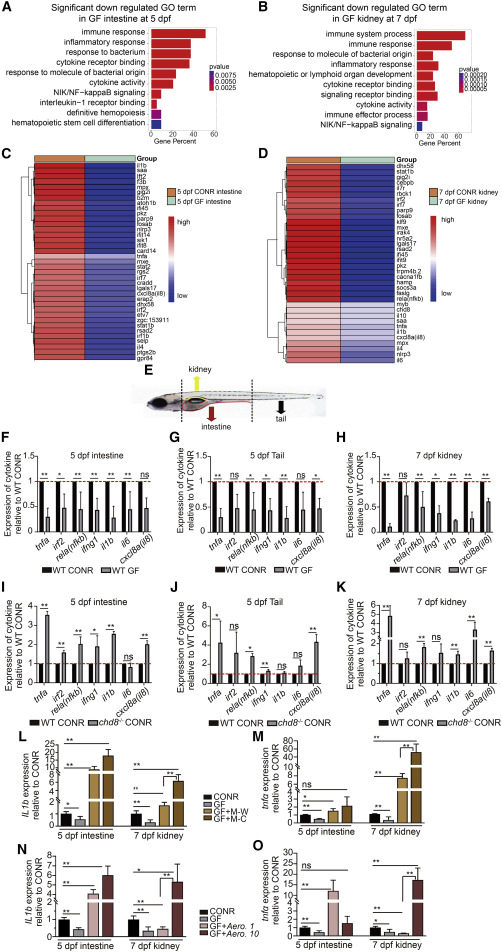
Fig. 5 Microbiota mediates inflammatory signals in the intestine, tail, and kidney (A and B) Gene ontology (GO) analysis of differentially expressed genes revealed inflammatory signaling enriched in downregulated genes in the intestine (A) and kidney (B) after GF treatment. (C and D) Heatmap analysis showed comparison of gene expression in the intestine (C) and kidney (D) between CONR and GF larvae. Multiple inflammatory signaling genes were decreased in GF larvae. (E) Schematic representation of tissues collected from the intestine (5 dpf), tail (including CHT region, 5 dpf), and kidney (7 dpf) for qPCR analysis. (F–H) qPCR analysis of representative cytokine genes in the intestine, tail, and kidney in WT CONR and GF larvae. (I–K) qPCR analysis of cytokine genes in the intestine, tail, and kidney in CONR WT and chd8−/− larvae. (L and M) qPCR analysis of il1b (L) and tnfa (M) in the intestine and kidney obtained from WT CONR, GF larvae, and GF larvae at 3 dpf treated with WT-sourced microbiota (M-W) or chd8−/−-sourced microbiota (M-C). (N and O) qPCR analysis of il1b (N) and tnfa (O) in the intestine and kidney obtained from WT CONR, GF larvae, and GF larvae treated with Aero. 1 or Aero. 10. Student’s t tests in (F–K), ANOVA in (L–O); mean ± SEM of more than three independent experiments, n = 30–40 larvae per group for qPCR analysis, ∗p < 0.05, ∗∗p < 0.01; ns, not significant. See also Figures S5 and S6.
Image
Figure Caption
Acknowledgments
This image is the copyrighted work of the attributed author or publisher, and
ZFIN has permission only to display this image to its users.
Additional permissions should be obtained from the applicable author or publisher of the image.
Full text @ Cell Rep.

