IMAGE

Fig. 7

ID
ZDB-IMAGE-240109-78
Source
Figures for Lawir et al., 2024
Image
Figure Caption

Fig. 7 
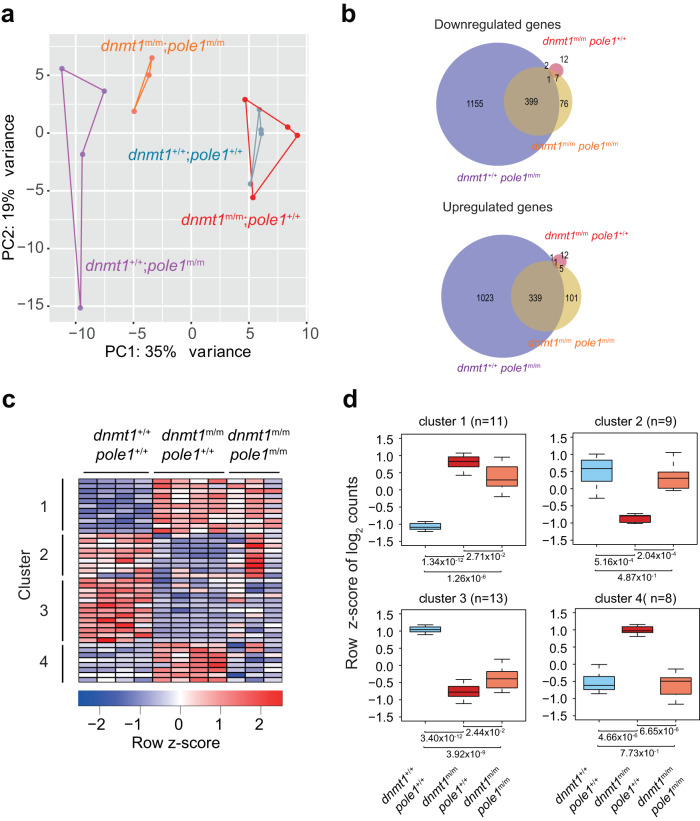
Transcriptional landscapes in dnmt1 and pole1 mutants.

a Dynamic changes in transcriptomes of dnmt1 and pole1 single and double mutants, as indicated by principal component analysis. b Venn diagram indicating the overlap of differentially expressed genes for down-regulated and up-regulated genes in fish of the indicated genotypes. c Four clusters of co-regulated genes are identified in dnmt1 mutant fish; each column represents a biological replicate. d Co-regulation of groups of genes in (c) identifies 2 gene clusters with restored wild-type levels in dnmt1/pole1 double mutants; box plots (mean; box, upper/lower quartile; whiskers, minimal/maximal values).

Acknowledgments
This image is the copyrighted work of the attributed author or publisher, and ZFIN has permission only to display this image to its users. Additional permissions should be obtained from the applicable author or publisher of the image. Full text @ Commun Biol