IMAGE

Fig. 6

ID
ZDB-IMAGE-240109-77
Source
Figures for Lawir et al., 2024
Image
Figure Caption

Fig. 6 
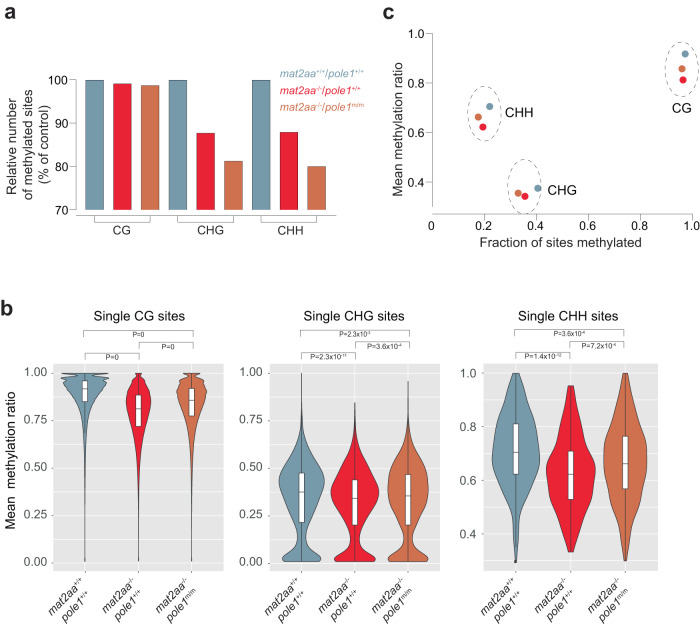
Alterations in non-CG methylation patterns in mat2aa and pole1 mutants.

a Variable numbers of methylated sites for CG dinucleotides, and CHG and CHH tri-nucleotides. The number of sites in wild-type fish is set to 100 (for absolute numbers of total and methylated sites, see Supplementary Table 1). b Violin plots of methylation ratios; median±m.a.d. The significance levels of the differences between mean methylation ratios are indicated (t-test, two-tailed; corrected for multiple testing). c Correlation plot between the fractions of sites methylated and their mean methylation ratios. For b, c, color code for genotypes indicated in a.

Acknowledgments
This image is the copyrighted work of the attributed author or publisher, and ZFIN has permission only to display this image to its users. Additional permissions should be obtained from the applicable author or publisher of the image. Full text @ Commun Biol