
Image
|
Figure Caption
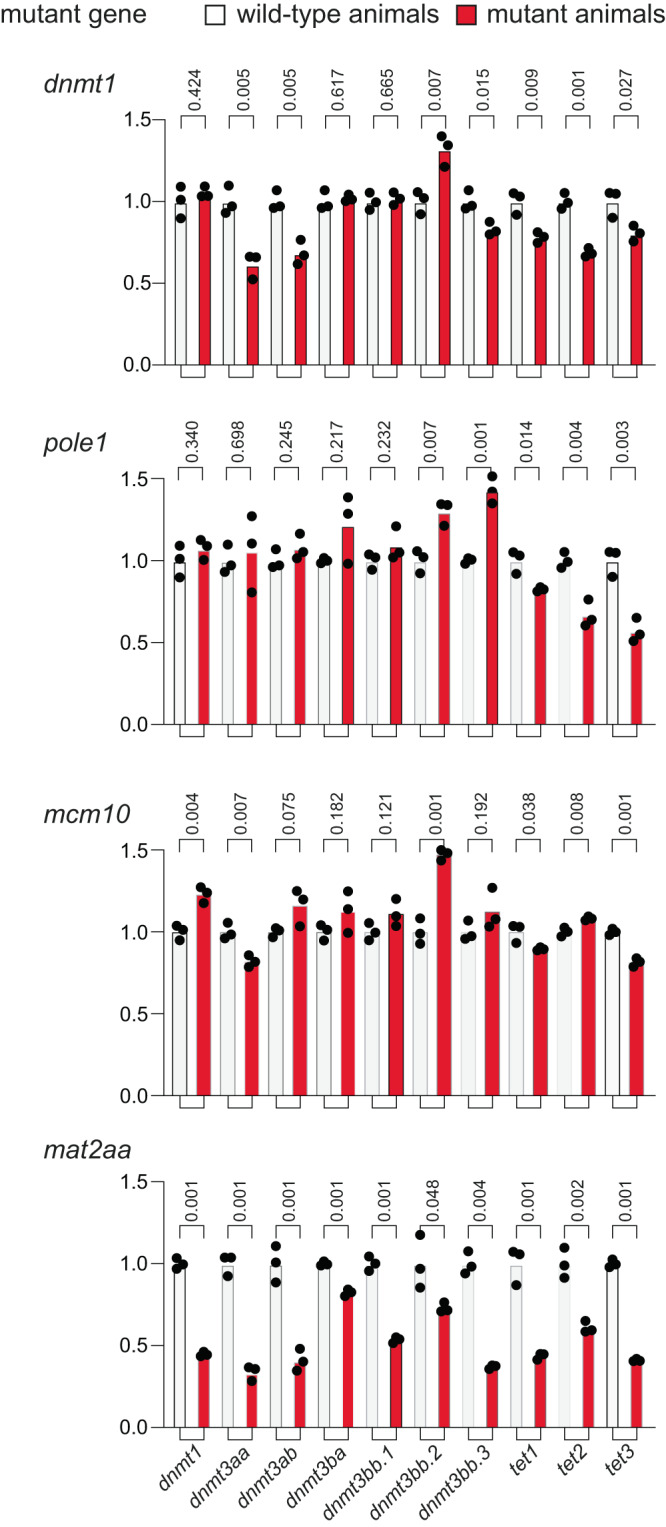
Fig. 4 Expression analysis of genes associated with the DNA methylation process.
qPCR analysis was performed on 5 dpf embryos of wild-type and mutants (
Acknowledgments
This image is the copyrighted work of the attributed author or publisher, and
ZFIN has permission only to display this image to its users.
Additional permissions should be obtained from the applicable author or publisher of the image.
Full text @ Commun Biol