
|
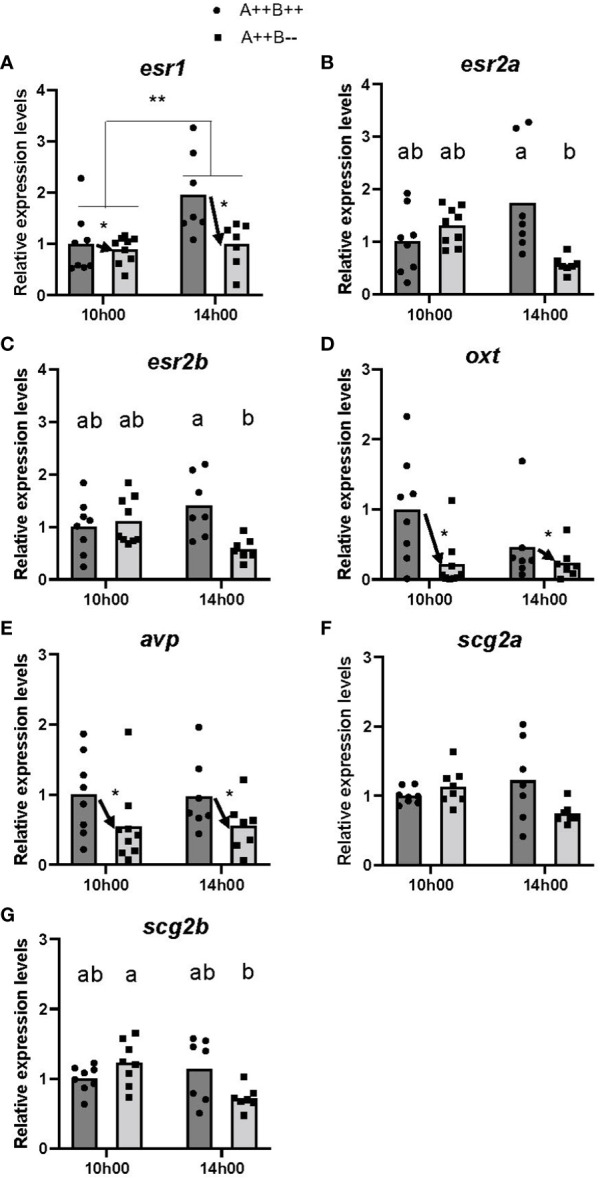
Figure 2
Gene expression in the hypothalamus of adult wildtype (A++B++) and cyp19a1b-/- mutant (A++B–) female zebrafish in the morning (10h00) and afternoon (14h00). The abundance of mRNAs (copies/µL) for all genes measured were normalized by tata-binding protein levels within the sample and data are plotted as fold change relative to the wildtype female levels at 10h00. Parametric data were analyzed by Two-Way ANOVA tests followed by Tukey’s multiple comparisons tests and individual values are plotted with bars representing mean values