
Fig. 1
- ID
- ZDB-IMAGE-231213-42
- Publication
- Chen et al., 2023 - Aerobic exercise enhances mitochondrial homeostasis to counteract D-galactose-induced sarcopenia in zebrafish
- All Figures
- Figures for Chen et al., 2023
|
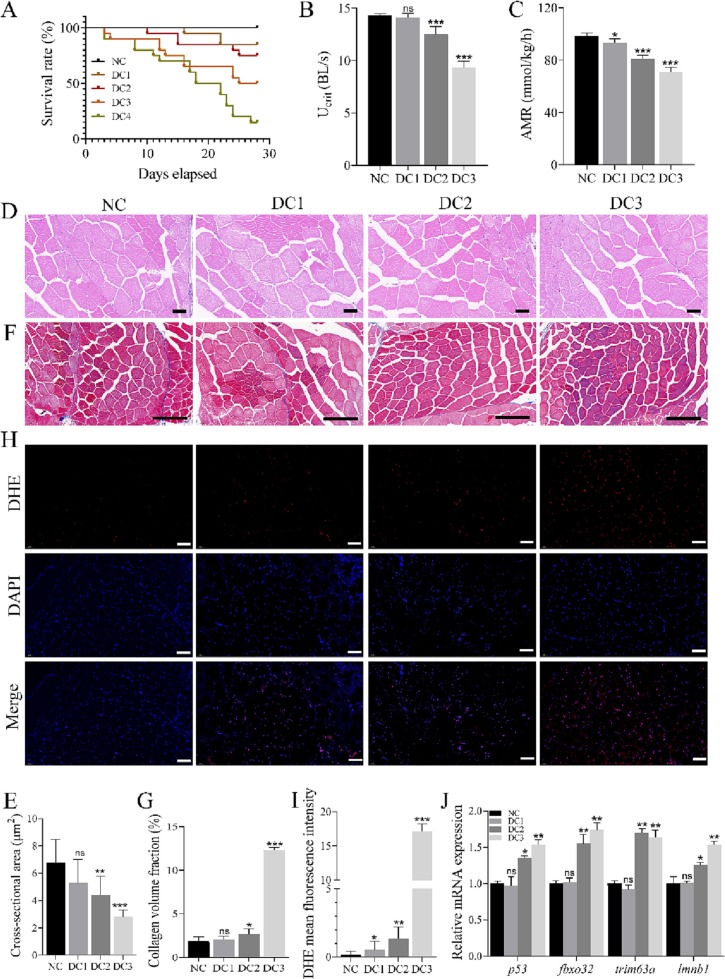
Fig. 1 A dip in d-galactose concentrations causes sarcopenia in zebrafish. (A) Survival curves for each group of zebrafish maintained under different concentration gradients of D-galactose (d-gal) solution (0, 200, 400, 800, or 1600 mg/L). (B, C) Effects of different concentrations of d-gal solution on the critical swimming speed (Ucrit) and exercise oxygen consumption (AMR) of zebrafish. (D) Hematoxylin and eosin staining of skeletal muscles in each zebrafish group. Scale bar: 500 μm. (E) The cross-sectional area of skeletal muscles (μm2) in each zebrafish group. (F) Masson's trichome staining of zebrafish skeletal muscle tissues in each group. Blue and red illustrate stained collagen fibers and myofibers, respectively. Scale bar: 100 μm. (G) Fibrosis fraction (%) of zebrafish in each group. (H) Dihydroethidium (DHE) staining of zebrafish skeletal muscle tissues in each group. Red and blue show reactive oxygen species (ROS) and nuclear staining, respectively. Scale bar: 100 μm. (I) Fluorescence quantification value of ROS stains for each zebrafish group. (J) mRNA expression of senescence and muscle atrophy marker genes, such as p53, fbxo32, trim63a, and lmnb1, in skeletal muscles of each group of zebrafish. * represents d-gal-treated controls (DC) compared with normal controls (NC). * p < 0.05. *** p < 0.001. ns, not significant.