
|
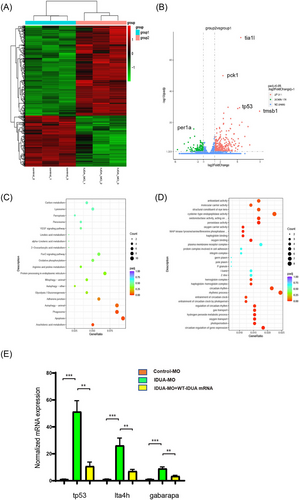
Fig. 8 RNA sequencing analyses reveal differentially expressed genes and pathways in response to knockdown of IDUA in zebrafish larvae. (A) The heat map clustering of 3 dpf control-MO and IDUA-MO zebrafish larvae. Red blocks represent the upregulated genes and the green blocks represent downregulated genes. (B) Volcano plot of the genes with significantly different expression in 3 dpf control-MO and IDUA-MO zebrafish larvae. (C) KEGG analysis of the differentially expressed genes. (D) GO biological processes analysis of the differentially expressed genes. (E) Expression of tp53, lta4h, and gabarapa mRNA was detected by qPCR in 3 dpf control-MO, IDUA-MO, and IDUA-MO + WT-IDUA mRNA zebrafish larvae. **p<0.01, ***p<0.001.