
|
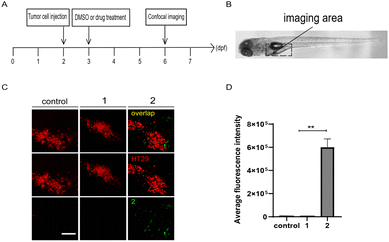
Fig. 6 Compound 2 targets tumor cells in zebrafish xenografts. (A) The time scheme for the experiments in (C) and (D). 1 (10 μM) and 2 (10 μM) were added to the embryo medium accordingly. (B) Scheme of the tumor cell injection site and subsequent imaging area. (C) Representative confocal images of HT29 tumor cells, compounds 1 and 2 in zebrafish xenografts at 6 dpf. (D) Summary of the fluorescent intensity of compounds 1 and 2 from (C), obtained by the excitation wavelength of 450 nm (λex = 450 nm). Results are expressed as mean ± SEM from three independent experiments, n = 6–10 embryos per condition (**p < 0.01, t-test). Scale bars in (C): 25 μm; dpf, days post fertilization.