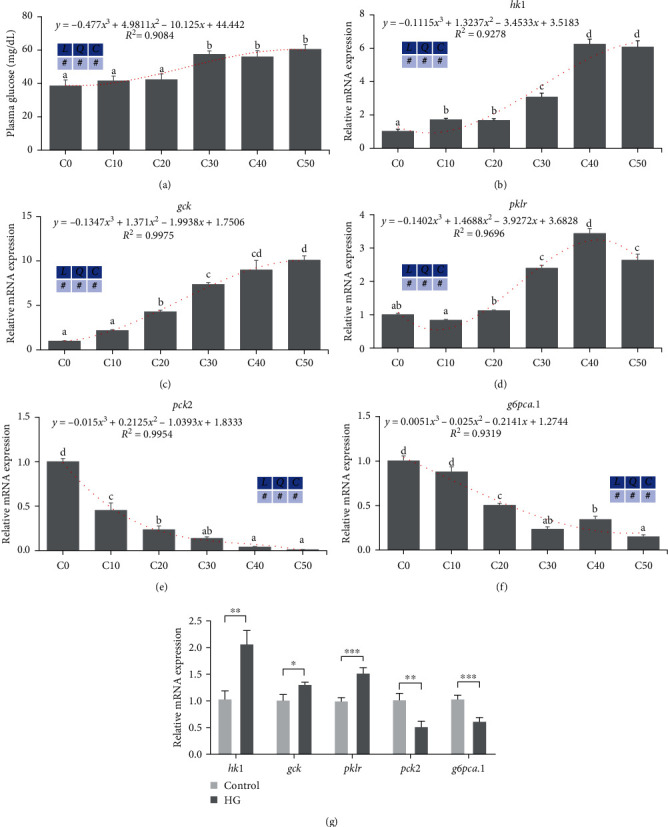
Excess carbohydrates activated glycolysis and suppressed gluconeogenesis in zebrafish and ZFL (means ± SEM, n = 6). C0, C10, C20, C30, C40, and C50 represent diets in which dextrin levels are 0%, 10%, 20%, 30%, 40%, and 50%, respectively. L represents a linear trend, Q represents a quadratic trend, C represents a cubic trend, and # represents the significant of the corresponding regressions. HG represents high glucose. (a) Plasma glucose, (b–d) glycolysis-related genes' expression in zebrafish liver, (e and f) gluconeogenesis-related genes' expression in zebrafish liver, and (g) glycolysis and gluconeogenesis related genes' expression in ZFL. Labeled means without a common letter differ among C0, C10, C20, C30, C40, and C50, P < 0.05 (one-way ANOVA, Duncan's post hoc test). ∗P < 0.05, ∗∗P < 0.01, ∗∗∗P < 0.005 (two-tailed independent t-test).
Acknowledgments
This image is the copyrighted work of the attributed author or publisher, and
ZFIN has permission only to display this image to its users.
Additional permissions should be obtained from the applicable author or publisher of the image.
Full text @ Aquac Nutr
Your Input Welcome
Thank you for submitting comments. Your input has been emailed to ZFIN curators who may contact you if
additional information is required.
Oops. Something went wrong. Please try again later.