
Image
|
Figure Caption
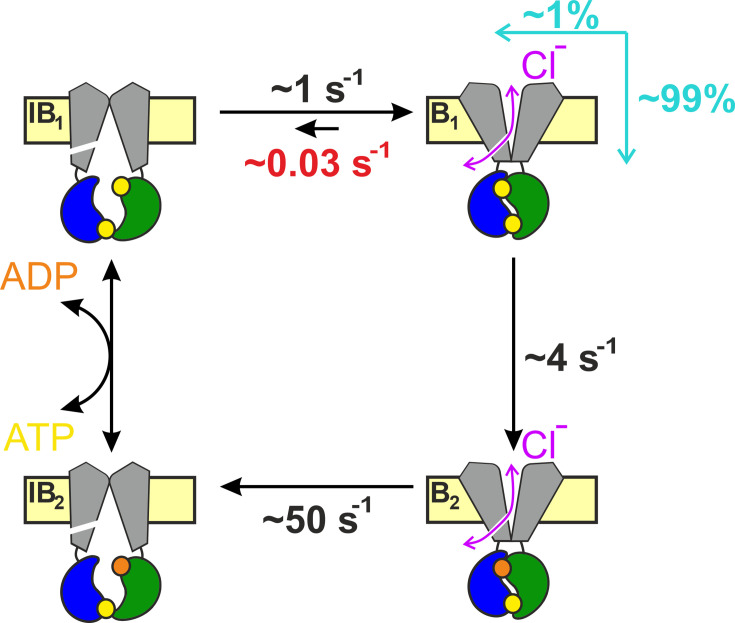
Figure 6. Coupling between bursts and ATP hydrolysis in wild-type (WT) hCFTR.
Quantitative hCFTR gating cycle, color coding as in
Acknowledgments
This image is the copyrighted work of the attributed author or publisher, and
ZFIN has permission only to display this image to its users.
Additional permissions should be obtained from the applicable author or publisher of the image.
Full text @ Elife