IMAGE

Fig. 6

ID
ZDB-IMAGE-231002-205
Source
Figures for Riesle et al., 2023
Image
Figure Caption

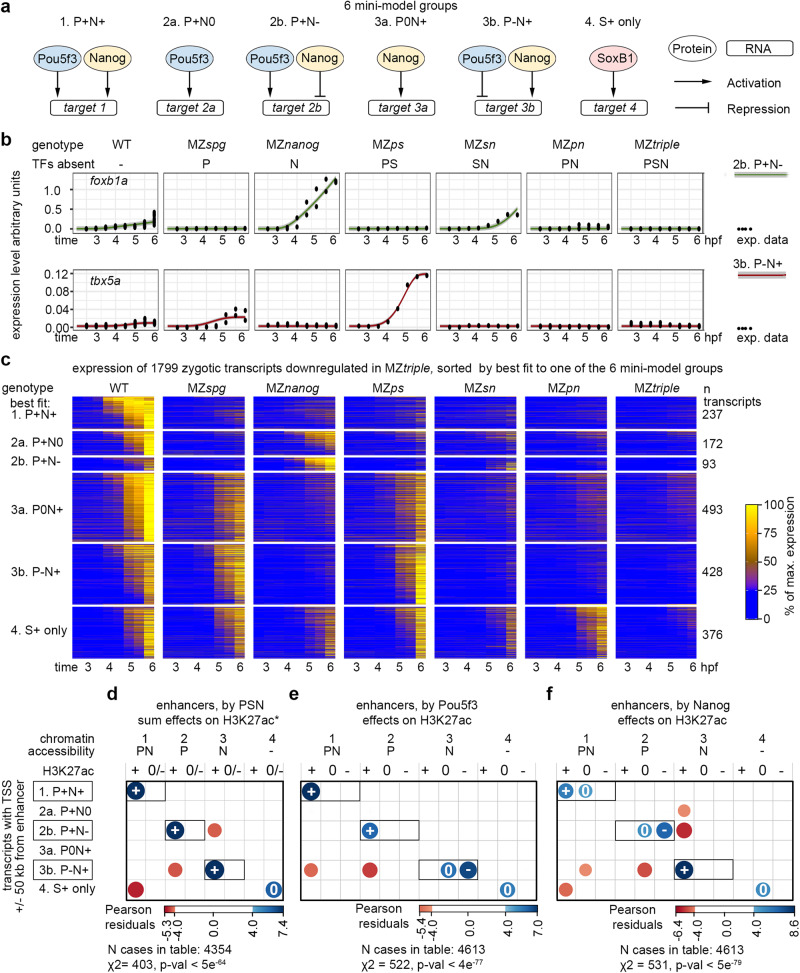
Fig. 6 Zygotic gene expression is balanced by synergy and competition of Pou5f3 and Nanog on common enhancers.

a Schemes of six alternative mini-model groups for direct target regulation by Pou5f3, Nanog and SoxB1. bfoxb1a and tbx5a transcripts dynamics fitted best to the antagonistic groups 2b. P + N- and 3b. P-N+ respectively. c Heatmap of zygotic genes, downregulated in MZtriple, sorted by best fit to one of the six model groups. df Two-sided χ2 tests, positive correlations between the transcriptomics and genomics groups are shown in blue and negative in red. Exact p-values: p = 4.292e-64 (d), p = 3.128e-77 (e), p = 4.314e-79 (f). Vertical axis: transcriptomics groups. Direct enhancers linked to the promoters of zygotic genes were sorted by best fit transcriptional model. Synergistic and antagonistic model groups are boxed. Horizontal axis: direct enhancers were sorted by chromatin accessibility, and by H3K27ac regulation by sum of PSN activities (d), by Pou5f3 (e), or by Nanog (f). *- data from5. Source data are provided as a Source Data file 2 (a-c) and Source Data file 3 (df).

Acknowledgments
This image is the copyrighted work of the attributed author or publisher, and ZFIN has permission only to display this image to its users. Additional permissions should be obtained from the applicable author or publisher of the image. Full text @ Nat. Commun.