IMAGE

Figure 2

ID
ZDB-IMAGE-231002-191
Source
Figures for Fernandes et al., 2023
Image
Figure Caption

Figure 2

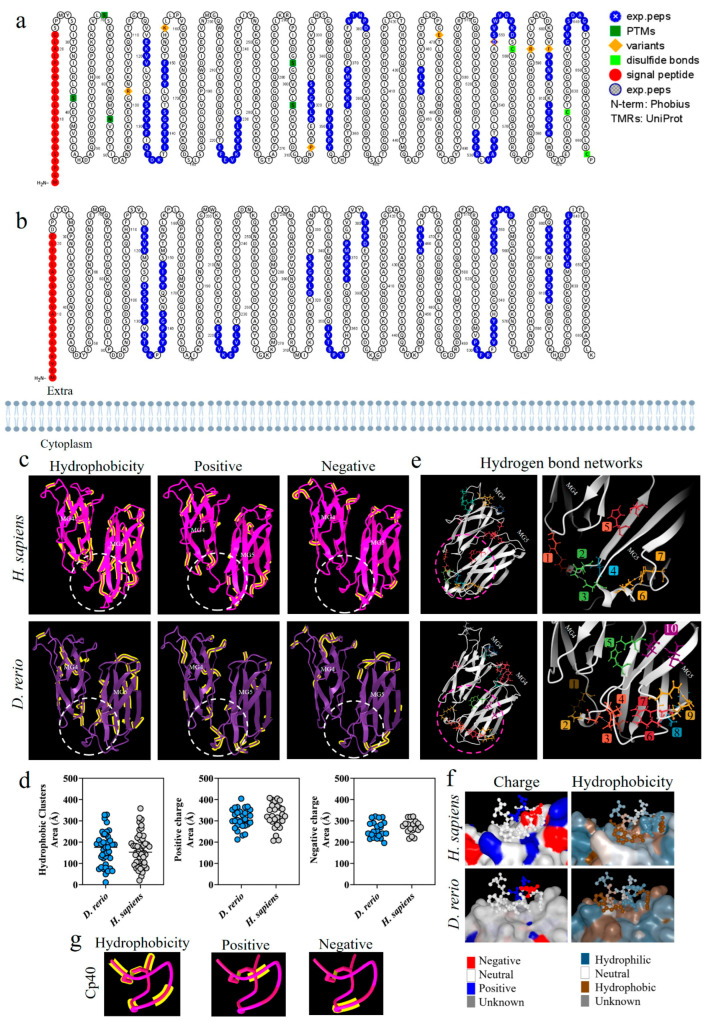
Comparative analysis on the C3-molecule β chains from D. rerio and H. sapiens. (a,b) Representation of C3 proteoforms (residues 1-645) from D. rerio and H. sapiens showing similar peptide sequences between species, as identified in blue; (c) structural and physicochemical characteristics of the C3 β-chain MG4 and MG5 domains in three-dimensional form showing the properties of amino acid residues in terms of hydrophobicity and positive and negative charges; (d) graphs showing the distribution of these amino acids according to area in Å; the networks are numbered and correlated with the color of the residuals; (e) distribution of hydrogen bond networks in the MG4 and MG5 domains; the circle drawn shows in detail the regions of the binding site based on the PDB model: 2QKI. In (f), the distribution of areas according to charges and hydrophobicity, on the surface between the ligand and the receptor at the binding site, is shown in detail, and in (g) the charge and hydrophobicity properties of Cp40 are exhibited. The numerical sequences refer to the colors that represent each network of hydrogen bonds.

Acknowledgments
This image is the copyrighted work of the attributed author or publisher, and ZFIN has permission only to display this image to its users. Additional permissions should be obtained from the applicable author or publisher of the image. Full text @ Int. J. Mol. Sci.