Figure Caption
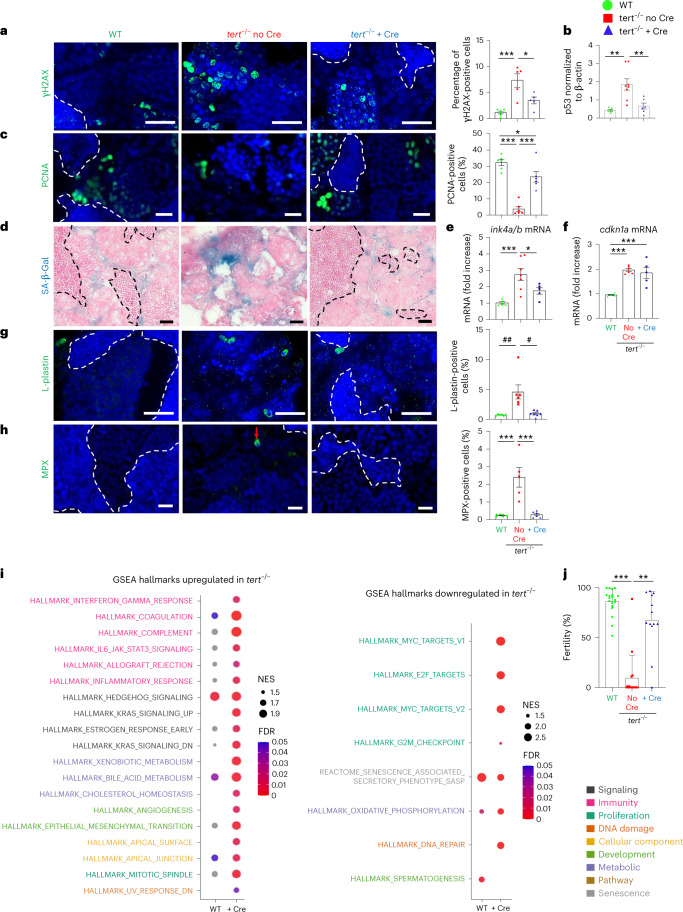
Gut-specific tert expression rescues the aging phenotypes of testes.a–e, Delaying gut aging in tert−/− + Cre fish rescues DNA damage, proliferation and senescence in the testes compared to tert−/− no Cre fish. a, Representative immunofluorescence images of DNA damage staining (γH2AX, left) and quantification (right, nWT = 6, 𝑛𝑡𝑒𝑟𝑡−/−noCre = 5 and 𝑛𝑡𝑒𝑟𝑡−/−+Cre = 5 fish) in the tissue of testes. b, Quantification of p53 protein levels (normalized by β-actin) in 9-month-old testes extracts analyzed by western blot (nWT = 6, 𝑛𝑡𝑒𝑟𝑡−/−noCre = 8 and 𝑛𝑡𝑒𝑟𝑡−/−+Cre = 8 fish). c, Representative immunofluorescence images of proliferation staining (left, PCNA) and quantification (right, n = 6 fish per group) in the tissue of testes. d, Representative image of SA-β-Gal staining of 9-month-old testes cryosections. e,f, RT–qPCR analysis of the senescence-associated genes ink4a/b (p15/16) (e) and cdkn1a (p21) (f) expression in testes samples (nWT = 6 and 5, 𝑛𝑡𝑒𝑟𝑡−/−noCre = 7 and 6 and 𝑛𝑡𝑒𝑟𝑡−/−+Cre = 5 and 5 fish, respectively). g, Representative immunofluorescence images of immune cell staining (left, L-plastin) and quantification (right, nWT = 6, 𝑛𝑡𝑒𝑟𝑡−/−noCre = 6 and 𝑛𝑡𝑒𝑟𝑡−/−+Cre = 7 fish) in testes tissues. h, Representative immunofluorescence images of neutrophil staining (left, MPX) and quantification (right, nWT = 6, 𝑛𝑡𝑒𝑟𝑡−/−noCre = 5 and 𝑛𝑡𝑒𝑟𝑡−/−+Cre = 6 fish) in the tissue of testes. i, Identification of upregulated (left) or downregulated (right) hallmarks in the testes of tert−/− no Cre fish compared to either WT or tert−/− + Cre, based on GSEA. The NES depict to what degree the pathway’s genes are overrepresented in WT or tert−/− + Cre, compared to tert−/− no Cre fish. j, Quantification of male fertility of fish determined by counting the percentage of fertilized eggs (detected by successful embryogenesis events) after individually crossing 9-month-old males with a young (3–6-month-old) WT female (nWT = 19, 𝑛𝑡𝑒𝑟𝑡−/−noCre = 16 and 𝑛𝑡𝑒𝑟𝑡−/−+Cre = 13 fish). All analyses were done on sections of 9-month-old fish testes or extracts. Scale bar, 20 µm. The dashed lines delineate the area of mature spermatids. All data are presented as the mean ± s.e.m. *P < 0.05, **P < 0.01, ***P < 0.001, using a one-way ANOVA and post hoc Tukey test; and *P < 0.05, **P < 0.01 using a Kruskal–Wallis and post hoc Dunn test. The RT–qPCR graphs represent the mean ± s.e.m. Note the mRNA fold increase after normalization by rps11 gene expression levels.
Source data