Figure Caption
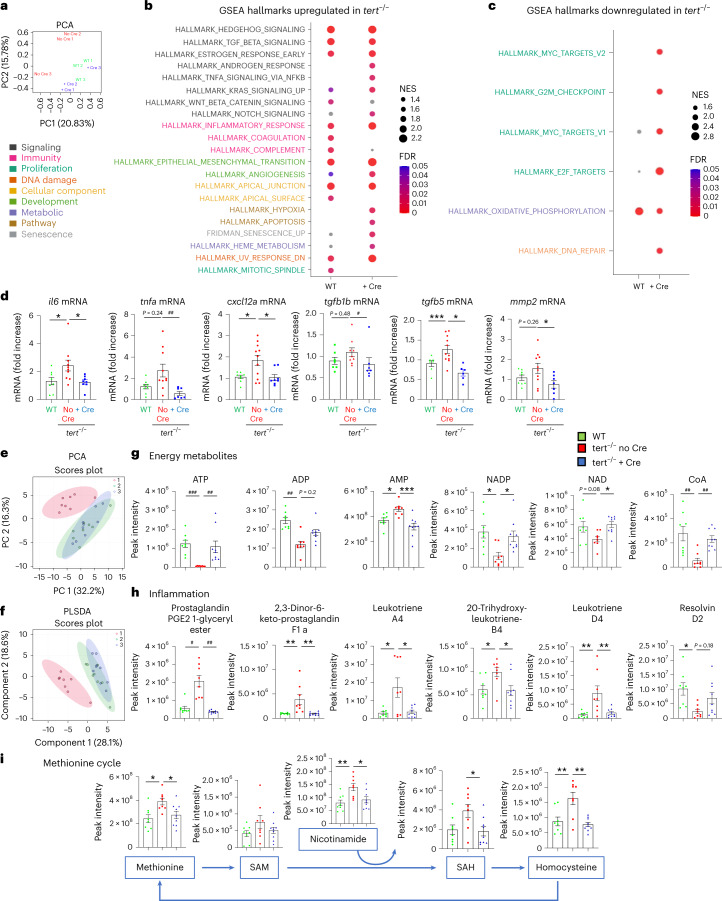
Gut-specific tert expression rescues gut transcriptomics and metabolomics profiles.a, Principal component analysis (PCA)-based on untargeted transcriptomics data of 9-month-old gut samples. A clustering between tert−/− + Cre and WT was observed while the tert−/− no Cre group was clearly distinguishable from tert−/− no Cre fish (n = 3 per group). b,c, Identification of upregulated (b) or downregulated (c) hallmarks in tert−/− no Cre compared to either WT or tert−/− + Cre, based on GSEA. The normalized enrichment scores (NES) depict to what degree the pathway genes are overrepresented in WT or tert−/− + Cre, compared to tert−/− no Cre. Gene sets related to senescence, inflammation and morphogenesis were enriched while the hallmarks of proliferation and oxidative phosphorylation were downregulated in the gut of tert−/− no Cre fish compared to the other two groups. d, RT–qPCR analysis of inflammation-related gene expression (il6, tnfa, tgfb1b and tgfb5) and SASP-related gene expression (il6, tnfa, cxcl12a, tgfb1b, tgfb5 and mmp2) in 9-month-old gut samples (nWT = 8 fish, 𝑛𝑡𝑒𝑟𝑡−/−noCre = 10 fish and 𝑛𝑡𝑒𝑟𝑡−/−+Cre = 8 fish for il6; nWT = 8 fish, 𝑛𝑡𝑒𝑟𝑡−/−noCre = 9 fish and 𝑛𝑡𝑒𝑟𝑡−/−+Cre = 8 fish for tnfa; nWT = 8 fish, 𝑛𝑡𝑒𝑟𝑡−/−noCre = 11 fish and 𝑛𝑡𝑒𝑟𝑡−/−+Cre = 8 fish for cxcl12; nWT = 7 fish, 𝑛𝑡𝑒𝑟𝑡−/−noCre = 9 fish and 𝑛𝑡𝑒𝑟𝑡−/−+Cre = 7 fish for tgfb1b; nWT = 7 fish, 𝑛𝑡𝑒𝑟𝑡−/−noCre = 11 fish and 𝑛𝑡𝑒𝑟𝑡−/−+Cre = 6 fish for tgfb5; and nWT = 8 fish, 𝑛𝑡𝑒𝑟𝑡−/−noCre = 10 fish and 𝑛𝑡𝑒𝑟𝑡−/−+Cre = 7 fish for mmp2). e,f, PCA (e) and partial least squares discriminant analysis (PLS-DA) (f) clustering analysis based on untargeted metabolomics data of 9-month-old gut samples. A clustering between tert−/− + Cre and WT was observed while the tert−/− no Cre group was clearly distinguishable from the other (nWT = 8 fish, 𝑛𝑡𝑒𝑟𝑡−/−noCre = 8 fish and 𝑛𝑡𝑒𝑟𝑡−/−+Cre = 9 fish). The score plot is presented with a confidence ellipse of 95%. g–i, Metabolomics analysis of energy metabolites (g), inflammatory metabolites (h) and methionine cycle pathway (i) in 9-month-old gut samples (nWT = 8 fish, 𝑛𝑡𝑒𝑟𝑡−/−noCre = 8 fish and 𝑛𝑡𝑒𝑟𝑡−/−+Cre = 9 fish). All data are presented as the mean ± s.e.m.; *P < 0.05, **P < 0.01, ***P < 0.001, using a one-way ANOVA and post hoc Tukey test; *P < 0.05; *P < 0.01, ***P < 0.001, using a Kruskal–Wallis and post hoc Dunn test).
Source data