IMAGE

Figure 3

ID
ZDB-IMAGE-230916-267
Source
Figures for Ramachandran et al., 2023
Image
Figure Caption

Figure 3

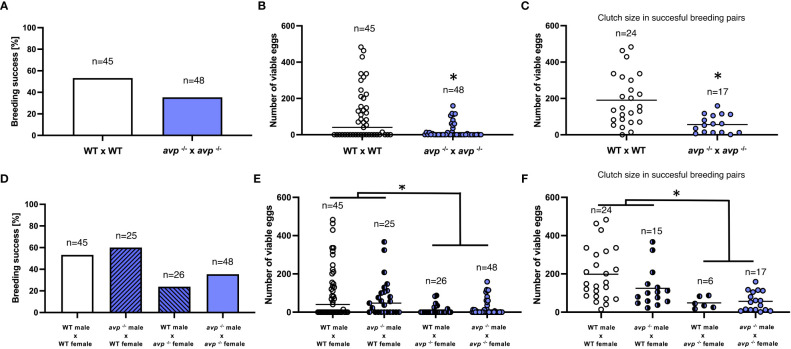
Assessment of reproductive success in WT (white bars and data points) and avp-/- (purple bars and data points) zebrafish. (A) Percent successful breeding trials in WT and avp-/- breeding pairs analyzed by Fisher’s exact test. (B) (Median) number of fertilized eggs in WT and avp-/- in all breeding trials analyzed by Mann-Whitney U test. Asterisk indicates a significant difference at P<0.01. (C) (Mean) clutch size expressed as the number of fertilized eggs in successful breeding trials analyzed by t-test. Asterisk indicates a significant difference at P<0.001. (D) Full-factorial crossbreeding experiments to delineate sex-specific contributions of the avp genoptype to reproductive success. Four crosses were bred: WT females x WT males; WT females x avp -/- males; WT males x avp -/- females; avp-/- males x avp-/- females. (D) (Median) number of fertilized eggs of each breeding trial across breeding groups analyzed by two-way ANOVA on ranks followed by Scheirer-Ray-Hare extension. (E) (Mean) Clutch size expressed as the number of fertilized eggs in successful breeding trials. Data were analyzed by two-way ANOVA (F).

Acknowledgments
This image is the copyrighted work of the attributed author or publisher, and ZFIN has permission only to display this image to its users. Additional permissions should be obtained from the applicable author or publisher of the image. Full text @ Front Endocrinol (Lausanne)