
|
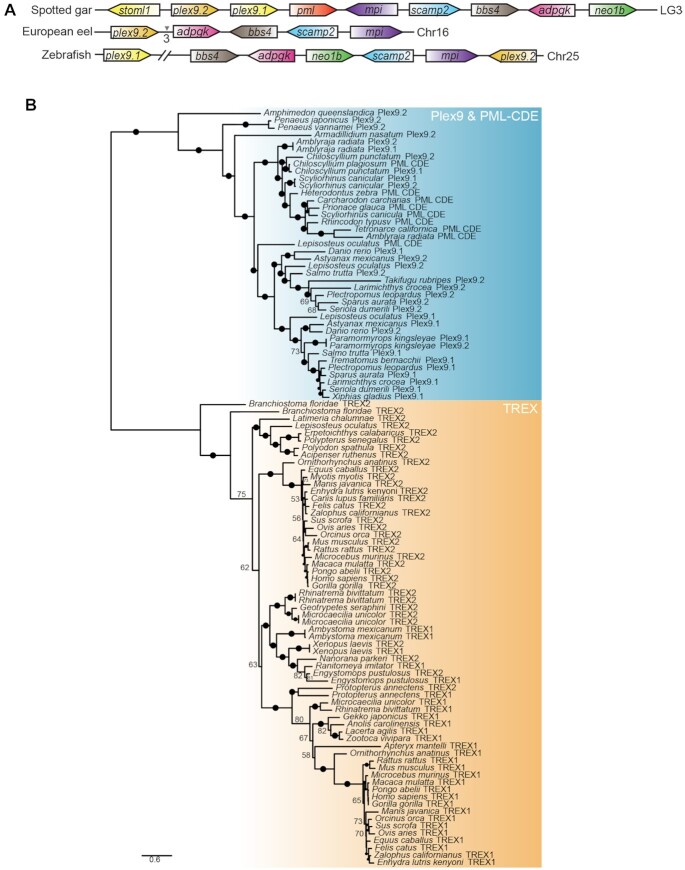
Fig. 3
Origins of PML-like exon 9 (Plex9) and TREX1 genes. (A) Teleost plex9 genes show synteny to the spotted gar pml locus. Similarly coloured genes represent homologs between species. The chromosome where the pml locus is found in each species is indicated on the right. The intervening arrows with numbers indicate the number of intervening adjacent genes that exist between the homologous genes not found in the syntenic region. (B) Plex9 homologs resemble both TREX1/2 and PML exonucleases but are related to PML exonucleases. A maximum likelihood tree was constructed using Plex9, PML CDE and TREX1/2 protein sequences. While the TREX1 proteins cluster with TREX2, sequences for Plex9 cluster with PML CDE sequences. Bootstrap values are indicated beside each node. Ultrafast bootstrap values are shown as numbers if <85% and indicated with solid dots on branches if >85%. Branch lengths indicate the expected number of amino acid substitutions per site.