
Image
|
Figure Caption
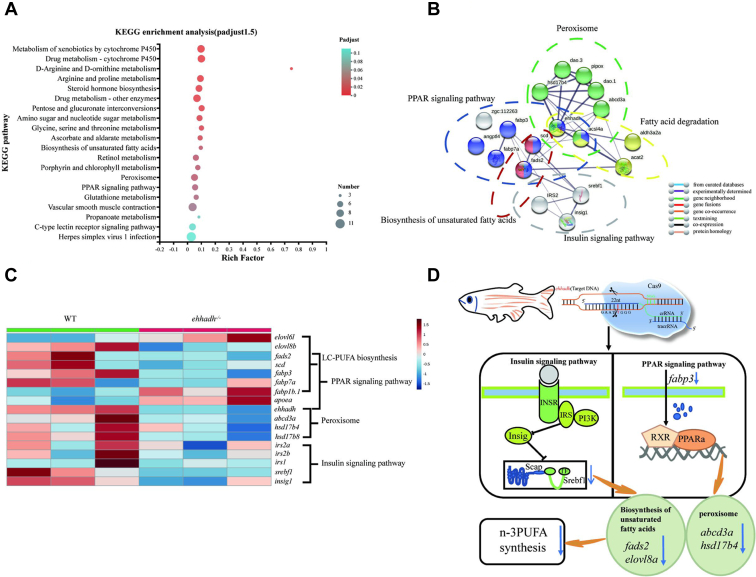
Fig. 2
Liver transcriptome analyses of WT zebrafish and Ehhadh-knockout zebrafish (Ehhadh−/−). A: KEGG pathway enrichment analysis of DEG from WT and Ehhadh−/−. B: Network interaction analysis between DEG corresponding proteins. C: DEG heat map analysis related to fatty acid metabolism. D: Flow chart of Ehhadh regulating DHA synthesis through the PPARα and insulin signaling pathways. The blue arrow indicates a significant decrease in expression. DEG, differentially expressed gene; Ehhadh, enoyl-CoA hydratase/3-hydroxyacyl CoA dehydrogenase.
Acknowledgments
This image is the copyrighted work of the attributed author or publisher, and
ZFIN has permission only to display this image to its users.
Additional permissions should be obtained from the applicable author or publisher of the image.
Full text @ J. Lipid Res.