
|
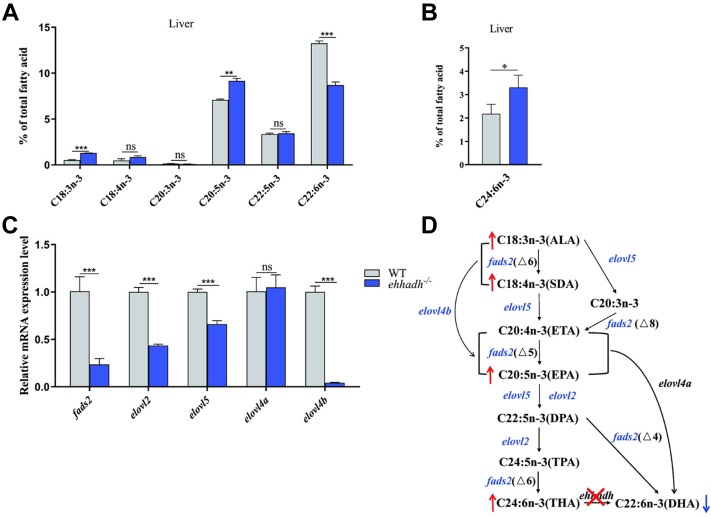
Fig. 1
Changes of liver fatty acid compositions and mRNA expression levels of fatty acid metabolism-related genes in Ehhadh-knockout zebrafish (Ehhadh−/−). A: liver n-3PUFA (18:3n-3; 18:4n-3; 20:3n-3; 20:5n-3; 22:5n-3; 22:6n-3) composition of WT zebrafish and Ehhadh−/−. B: liver C24:6n-3 content of WT and Ehhadh−/−. C: the mRNA expression levels of fads2, elovl2, elovl5, elovl4a, and elovl4b in livers of WT and Ehhadh−/−. D: the effect of Ehhadh knockout on DHA synthesis pathway. The blue font indicates that gene expression is significantly downregulated, the blue arrow indicates that the content of related fatty acids is significantly reduced, and the red arrow indicates that the content of related fatty acids is significantly increased. ns means no significant difference; ∗ means P < 0.05; ∗∗ means P < 0.01; ∗∗∗ means P < 0.001. Ehhadh, enoyl-CoA hydratase/3-hydroxyacyl CoA dehydrogenase; elovl2, fatty acid elongase 2; elovl4a, fatty acid elongase 4a; elovl4b, fatty acid elongase 4b; elovl5, fatty acid elongase 5; fads2, fatty acid desaturase 2; MUFA, mono-unsaturated fatty acid; PUFA, poly-unsaturated fatty acid; SFA, saturated fatty acid.