IMAGE

Figure 4

ID
ZDB-IMAGE-230814-242
Source
Figures for De la Cruz et al., 2023
Image
Figure Caption

Figure 4

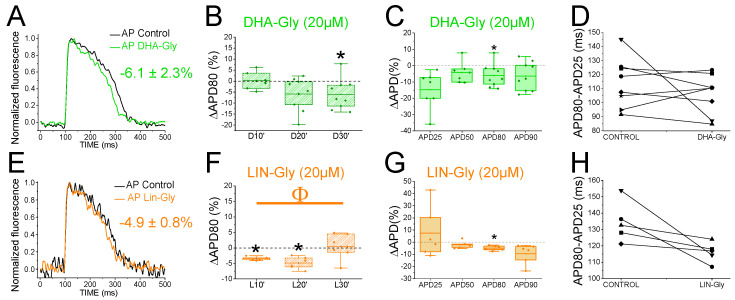
PUFA analogues have modest effects on zebrafish AP. (A) Representative zebrafish AP traces before (black) and after (light green) applying DHA-Gly (20 µM). (B) ΔAPD80 (%) after (light green) applying DHA-Gly (20 µM), as measured at different recording times (10, 20, and 30 min after application of the PUFA analogue). (C) ΔAPD (%) produced by the PUFA analogue measured for the APD25, APD50, APD80, and APD90. (D) Effect of the PUFA analogue on phase 3 of the AP. APD80–APD25 in control conditions and after DHA-Gly application. (EH) The same as in (AD) but for the PUFA analogue LIN-Gly (20 µM) (mean ± SEM; * p < 0.05 vs. control conditions, Φp < 0.05 APD80 time data average vs. control condition). Each symbol in panels D and H represent data from a different experiment.

Acknowledgments
This image is the copyrighted work of the attributed author or publisher, and ZFIN has permission only to display this image to its users. Additional permissions should be obtained from the applicable author or publisher of the image. Full text @ Int. J. Mol. Sci.