
IMAGE
Figure 6
- ID
- ZDB-IMAGE-230814-204
- Genes
- Publication
- Suzuki et al., 2023 - Cooperative contributions of the klf1 and klf17 genes in zebrafish primitive erythropoiesis
- All Figures
- Figures for Suzuki et al., 2023
Image
|
Figure Caption
Figure 6
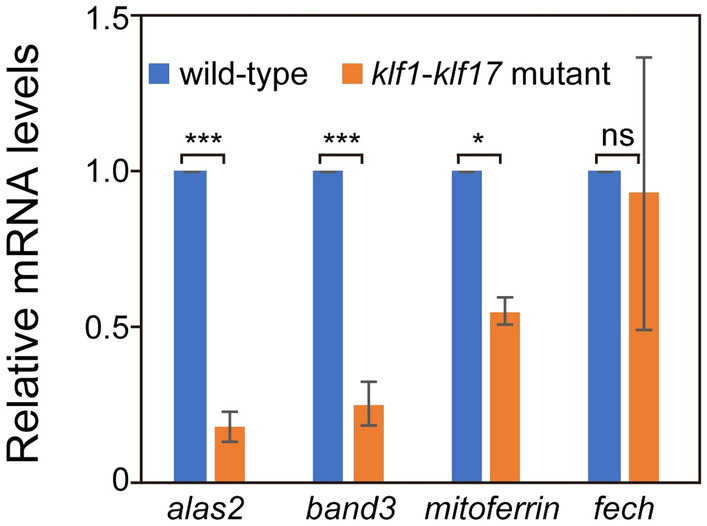
Expression levels of haematopoietic genes in the
Figure Data
Acknowledgments
This image is the copyrighted work of the attributed author or publisher, and
ZFIN has permission only to display this image to its users.
Additional permissions should be obtained from the applicable author or publisher of the image.
Full text @ Sci. Rep.