
Fig. 3
- ID
- ZDB-IMAGE-230810-3
- Publication
- Yao et al., 2023 - DExH/D RNA helicase 15 regulates zebrafish intestinal development through the Wnt signaling pathway
- All Figures
- Figures for Yao et al., 2023
|
Fig. 3
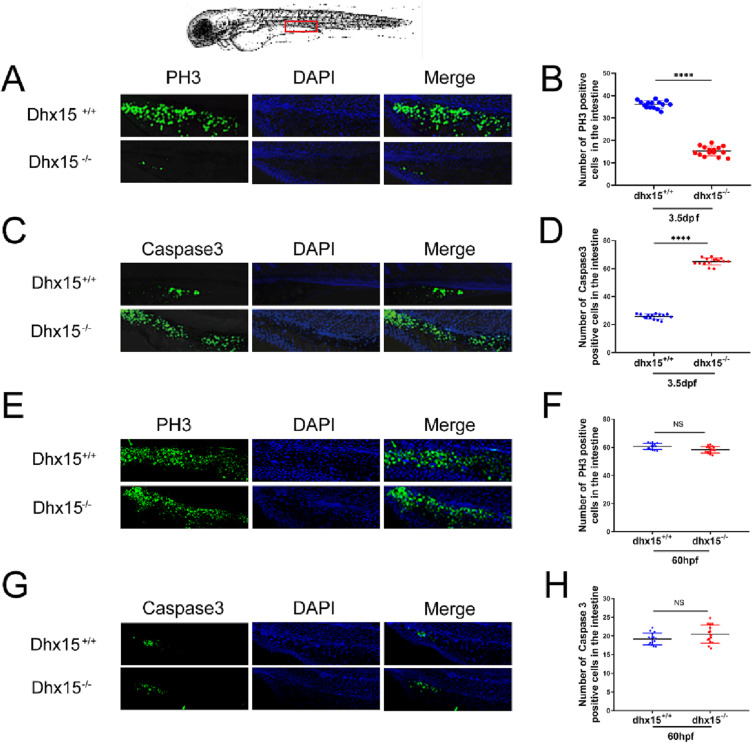
Fig. 3. Increased apoptosis and decreased proliferation were observed in dhx15 knockout zebrafish. (A) Representative images of PH3 immunofluorescence staining in dhx15+/+ and dhx15−/− zebrafish at 3.5 dpf. (B) The number of PH3-positive cells in the intestine of dhx15+/+ was significantly higher than that of dhx15−/− embryos at 3.5 dpf (P < 0.0001 by student t-test). (C) Representative images of Caspase3 immunofluorescence staining in dhx15+/+ and dhx15−/− zebrafish at 3.5 dpf. (D) The number of Caspase3 positive cells in the intestine of dhx15+/+ was significantly lower than that of dhx15−/− embryos at 3.5 dpf (P < 0.0001 by student t-test). (E) Representative images of PH3 immunofluorescence staining in dhx15+/+ and dhx15−/− zebrafish at 60 hpf. (F) The number of PH3-positive cells in the intestine of dhx15+/+ was comparable to that of dhx15−/− embryos at 60hpf (by student t-test). (C) Representative images of Caspase3 immunofluorescence staining in dhx15+/+ and dhx15−/− zebrafish at 60 hpf. (D) The number of Caspase3 positive cells in the intestine of dhx15+/+ was comparable to that of dhx15−/− embryos at 60 hpf (by student t-test). The red box outlined the location of immunofluorescence staining in the embryos. ****P < 0.0001, NS: not significant. (For interpretation of the references to colour in this figure legend, the reader is referred to the web version of this article.)