Fig. 3
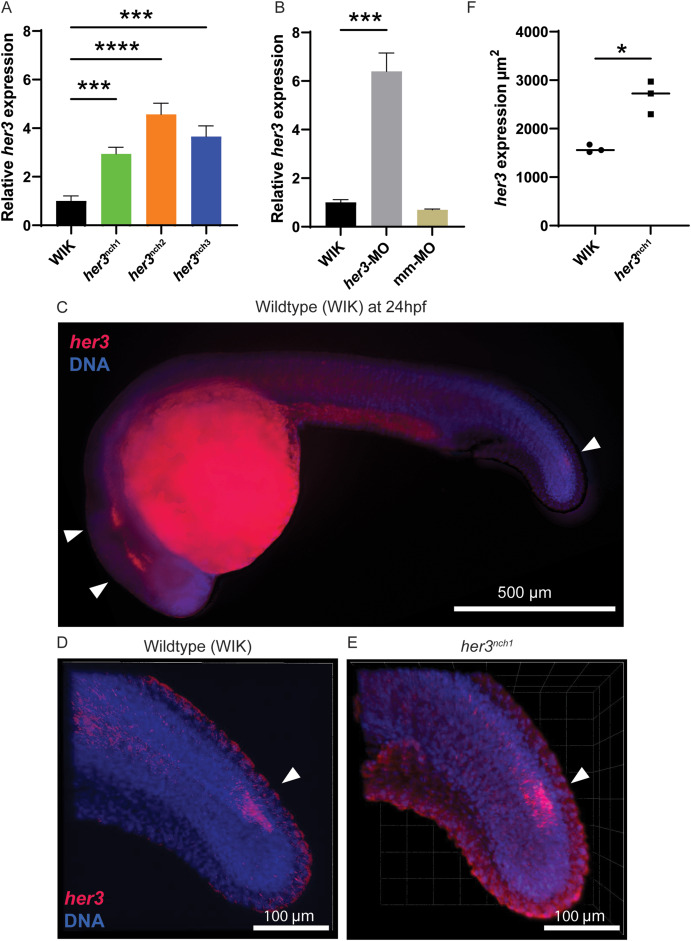
Fig. 3. her3 null mutation recapitulates her3-morpholino phenotype. (A) qRT-PCR for her3 from each her3 null mutant line compared to the wildtype WIK. qRT-PCR was done with 3 biological replicates per line, with each replicate containing a pool of 10, 24hpf embryos. Each biological replicate is comprised of three technical replicates. Statistical significance was determined by a one way ANOVA with Dunnett multiple comparison test. WIK- her3nch1: p = 1.82 × 10⁻³. WIK- her3nch2: p < 1.00 × 10⁻⁴. WIK- her3nch3: p < 1.00 × 10⁻⁴. (B) qRT-PCR for her3 with WIK, her3-MO, and mismatch (mm)-MO. 5–10 nL of morpholinos at a concentration of 500 μM were injected into the yolk of WIK embryos at the 1–4 cell stage. qPCR was done with 3 biological replicates per condition, with each replicate containing a pool of 10, 24hpf embryos. Each biological replicate is comprised of three technical replicates. Statistical significance was determined by a one way ANOVA with Dunnett multiple comparison test. WIK-her3-MO: p < 1.0 × 10⁻⁴. WIK-mm-MO: p = 8.46 × 10⁻¹, not significant. (C) RNAscope on whole mount 24hpf WIK wildtype zebrafish embryos. RNAscope targeting her3 RNA transcripts (red) was done and counterstained with DAPI (blue). Representative image was taken on a Leica M205FA fluorescent stereoscope out of three embryos evaluated. Scale bar is 500 μm. (D–E) RNAscope targeting her3 RNA transcripts was done on 24hpf WIK (D) and 24hpf her3nch1 (E) embryos and counterstained with DAPI. Images were taken on a Zeiss LSM800 confocal microscope with a 20x objective. Images shown are z-stack projections: (D) WIK is a projection of 53, 2 μm slices; (E) her3nch1 is a projection of 48, 2 μm slices. her3 is shown in red and DAPI is shown in blue. (F) Quantification of the area of her3 expression from (D–E) indicated by white arrowheads. WIK and her3nch1: n = 3 embryos per condition. A Welch's two-tailed t-test had a p-value of 2.62 × 10⁻².
Reprinted from Developmental Biology, 496, Kent, M.R., Calderon, D., Silvius, K.M., Kucinski, J.P., LaVigne, C.A., Cannon, M.V., Kendall, G.C., Zebrafish her3 knockout impacts developmental and cancer-related gene signatures, 1141-14, Copyright (2023) with permission from Elsevier. Full text @ Dev. Biol.

