
Image
|
Figure Caption
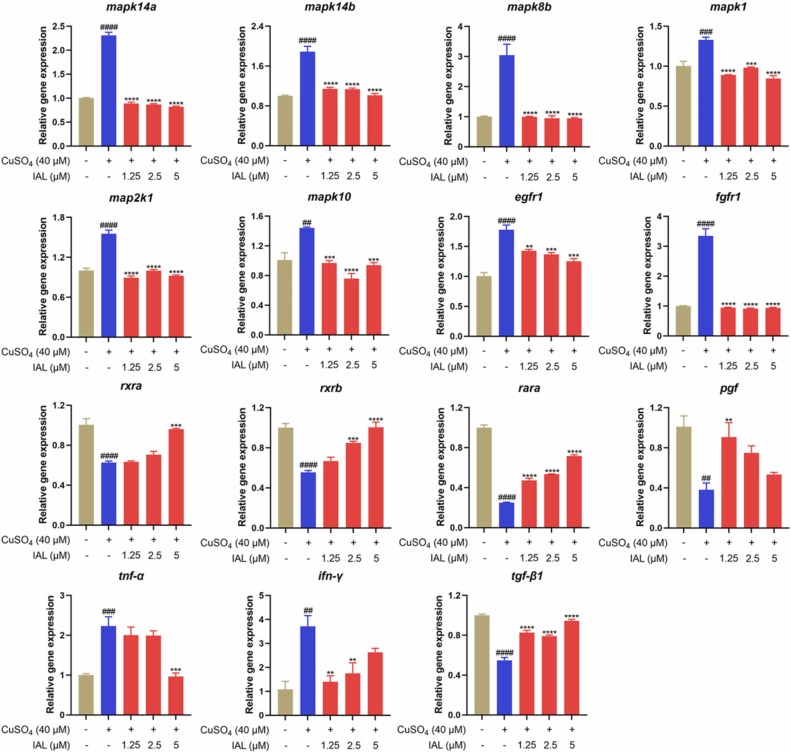
Fig. 9 Effect of IAL on the expression levels of inflammation-related genes in zebrafish. Data are expressed as mean ± SEM (n = 3). ##P < 0.01, ###P < 0.001, ####P < 0.0001 vs. the control group, **P < 0.01, ***P < 0.001, ****P < 0.0001 vs. the model group.
Acknowledgments
This image is the copyrighted work of the attributed author or publisher, and
ZFIN has permission only to display this image to its users.
Additional permissions should be obtained from the applicable author or publisher of the image.
Full text @ Biomed. Pharmacother.