
Image
|
Figure Caption
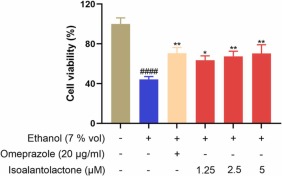
Fig. 1 Effects of different concentrations of IAL treatment on cell viability after ethanol injury. Data are expressed as mean ± SEM (n = 5). ####P < 0.0001 vs. the control group, *P < 0.05, **P < 0.01 vs. the model group.
Acknowledgments
This image is the copyrighted work of the attributed author or publisher, and
ZFIN has permission only to display this image to its users.
Additional permissions should be obtained from the applicable author or publisher of the image.
Full text @ Biomed. Pharmacother.