
|
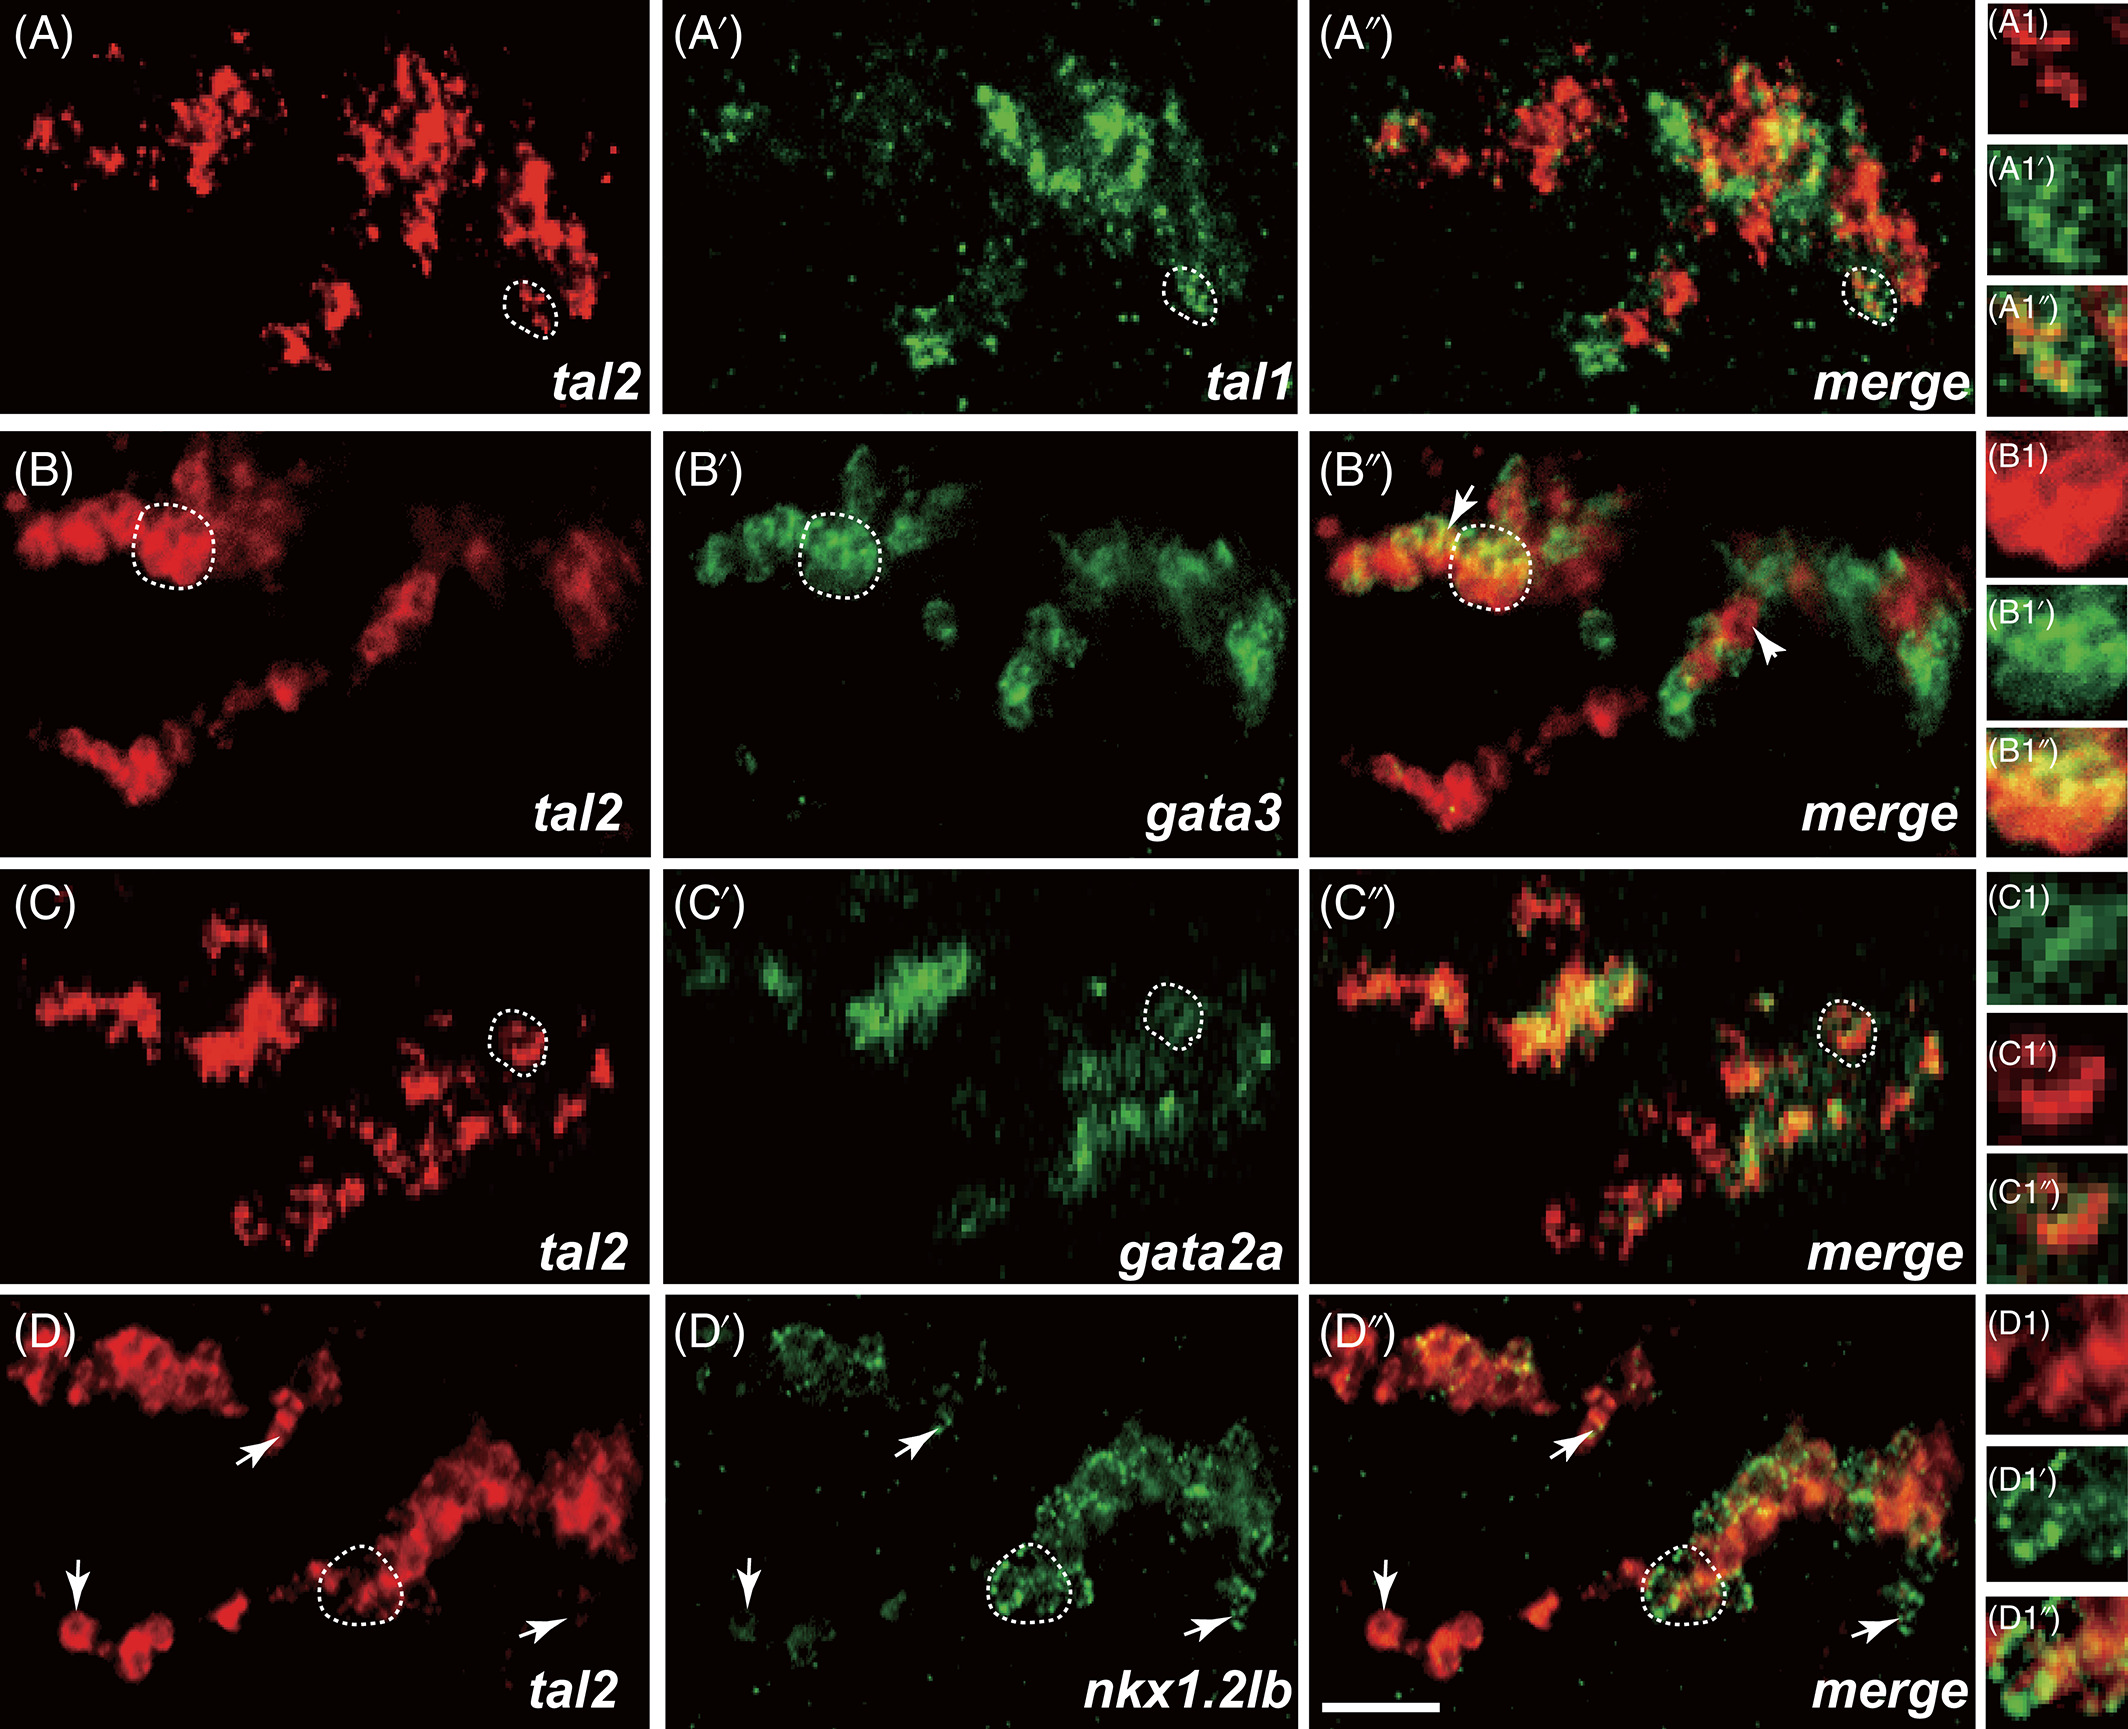
Fig. 4 Co-localized analysis of tal2 expressing cells and marker genes in the diencephalon and nMLF. (A-A″) Heads of wild-type of 30 hpf zebrafish hybridized to tal2 (A) and tal1 (A′) antisense probes, a merged view (A″), and views at the single cell level (A1 to A1″). tal2 and tal1 show an overlapping expression domain in the diencephalon and nMLF. (B-B″) tal2 expressing cells (B), gata3 mRNA expression (B′), a merged views (B″), and views at the single cell level (B1 to B1″). Almost all tal2 expressing cells co-express gata3, particularly in the dorsal stripe and nMLF. (C-C″) tal2 mRNA expression (C), gata2a-expressing cells (C′), merge (C″), and views at the single cell level (C1 to C1″). tal2 mRNA expression is identical to gata2a mRNA expression. (D-D″) tal2 (D), nkx1.2lb (D′) mRNA expression domains, merge (D″), and views at the single cell level (D1 to D1″). tal2 expressing cells and nkx1.2lb expressing cells are overlapping in the diencephalon and nMLF. (A-D″) single confocal section. Dashed regions in main panels (A-D″) are shown in magnified view in panels (A1-D1″). Dorsal is up; rostral, to the left. Scale bar: 25 μm