
|
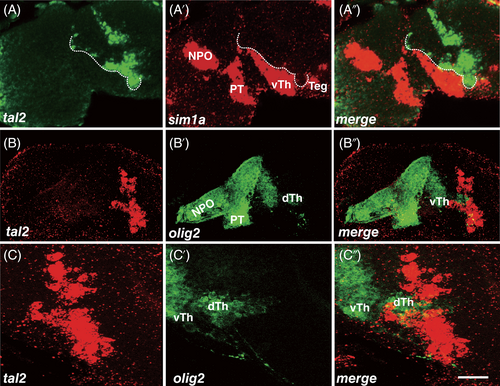
Fig. 2 Co-localized analysis of tal2 expressing cells and marker genes in the diencephalon. (A-A″) Heads of wild-type of 30 hpf zebrafish hybridized to tal2 (A) and sim1a (A′) antisense probes and a merged view (A″). The anterior strip of tal2-positive cells is along the boundary of sim1a expressing cells (dotted line). (B-C″) tal2 in situ hybridization (B and C), GFP immunohistochemistry (B′ and C′) and merged views (B″ and C″). Almost all GFP marked olig2 expressing cells are tal2 negative. Of note, the GFP-positive cells located dorsal thalamus extend and separate dorsal and ventral groups of tal2 expressing cells. (C-C″) The high magnification of images. (A-C″) projections of several sections. All embryos' eyes were removed by dissection. Dorsal is up; rostral, to the left. dTh, dorsal thalamus; NPO, neurosecretory preoptic area; PT, posterior tuberculum; Teg, tegmentum; vTh, ventral thalamus. Scale bar: 25 μm in A-B″ and 50 μm in C-C″