
|
Fig. 5
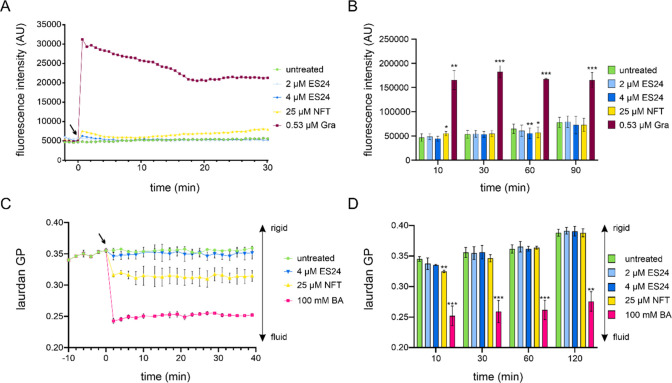
Effects of ES24 and NFT on B. subtilis membrane potential and fluidity. (A) Kinetic DiSC(3)5 spectroscopy measurements of B. subtilis 168CA treated with ES24, NFT, or positive control gramicidin (Gra). An increase in fluorescence intensity indicates membrane depolarization. The arrow indicates the time point of antibiotic addition. (B) End point measurements under the same conditions as in panel A up to 90 min. (C) Kinetic laurdan generalized polarization (GP) spectroscopy measurements of B. subtilis 168CA treated with ES24, NFT, or positive control benzyl alcohol (BA). A decrease in GP indicates membrane fluidization. The arrow indicates the time point of antibiotic addition. (D) End point measurements under the same conditions as in panel C up to 120 min. The p-values were calculated using a paired two-tailed t test. *p < 0.05, **p < 0.01, ***p < 0.001.