
|
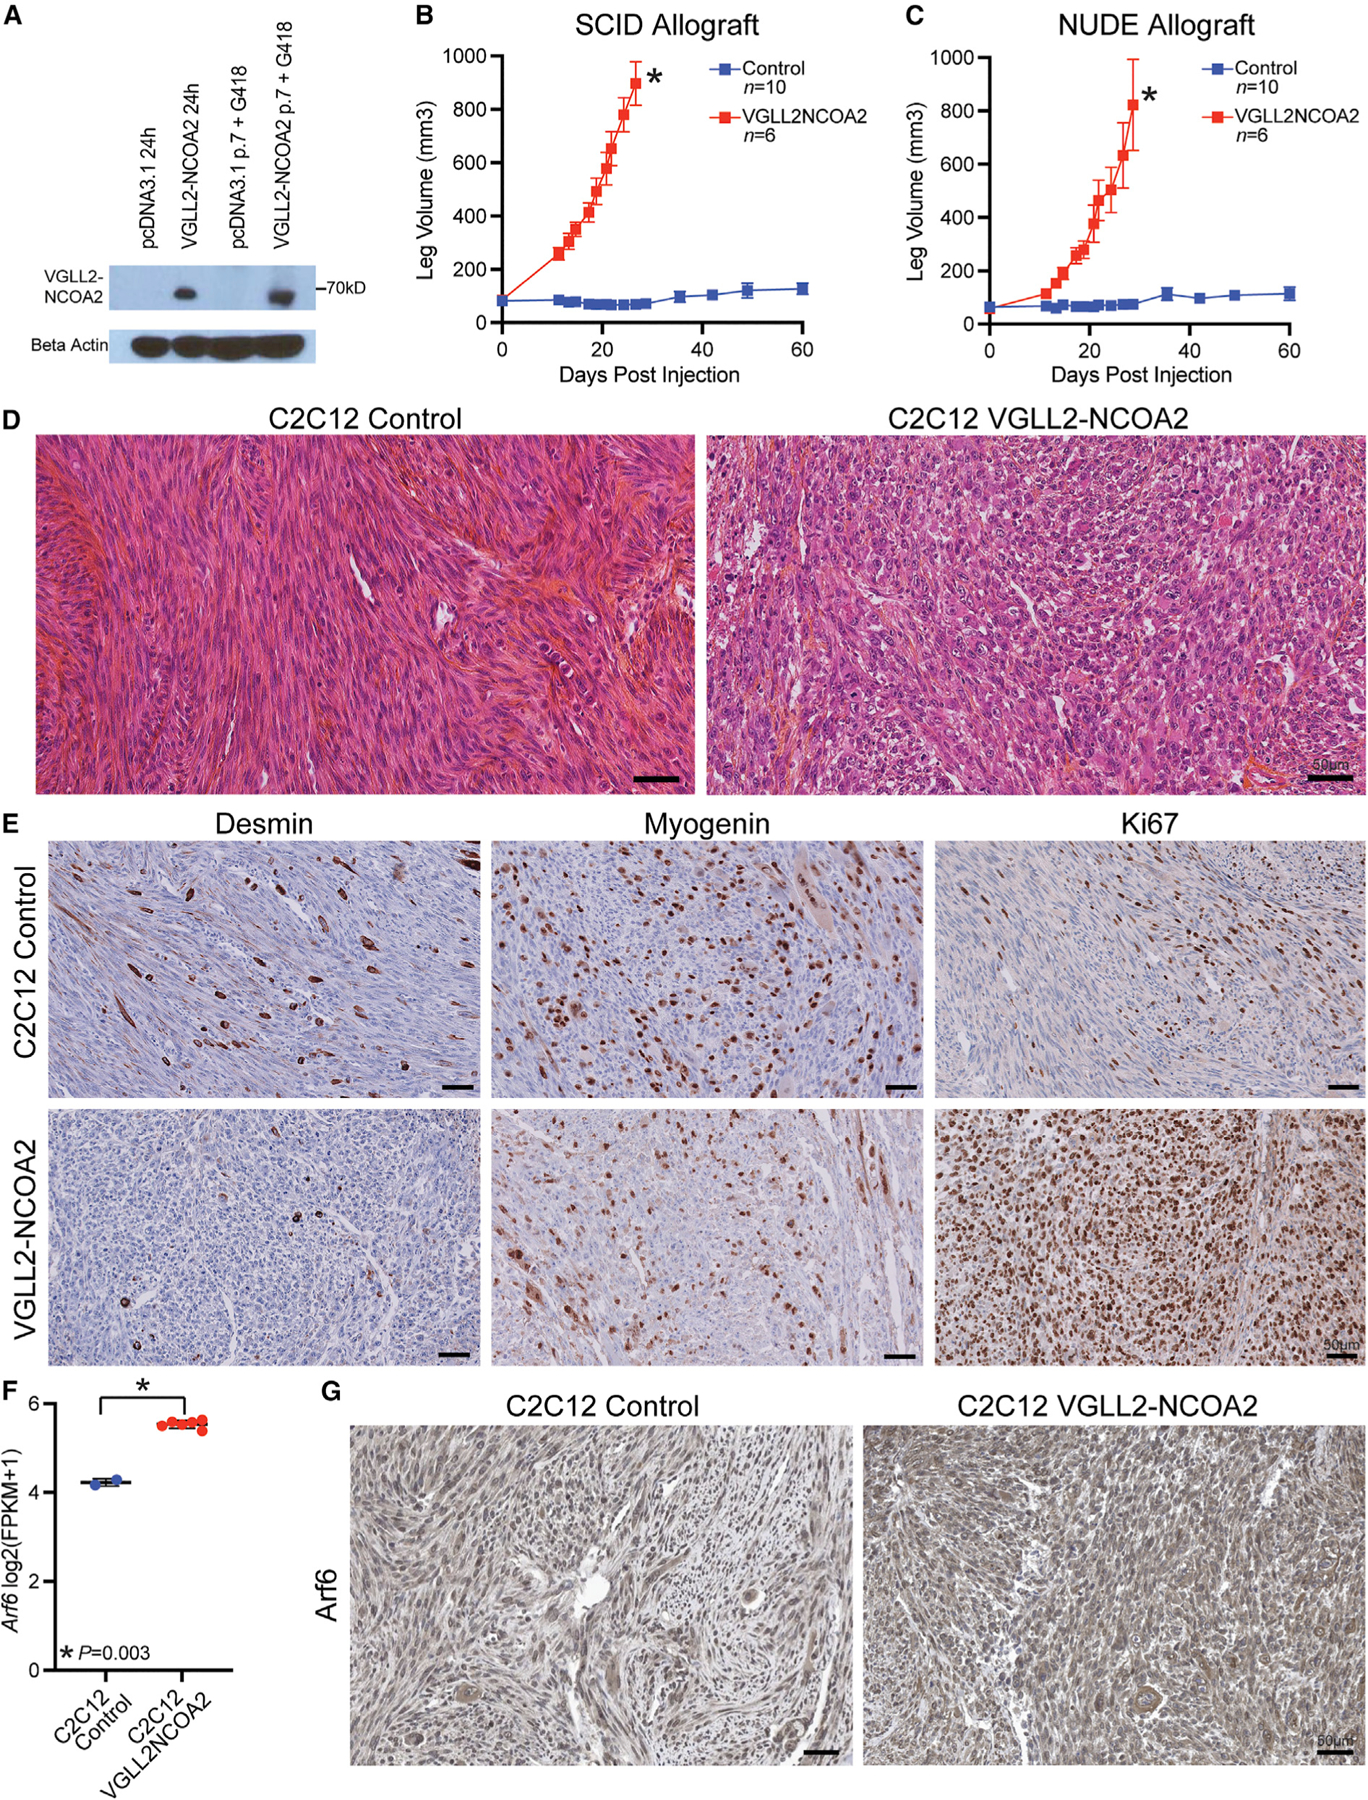
Fig. 6
(A) C2C12 mouse myoblasts transfected with human VGLL2-NCOA2 express the VGLL2-NCOA2 fusion protein 24 h post transfection and stably after passaging and selection in growth medium with G418 compared with a C2C12-pcDNA3.1 empty control.
(B) Allograft leg volume of C2C12-pcDNA3.1 control and C2C12-VGLL2NCOA2 after intramuscular injection into the leg of SCID mice. C2C12-pcDNA3.1 control was injected in n = 10 allografts and C2C12-VGLL2NCOA2 was injected in n = 6 allografts. The error bars represent the mean leg volume ± SEM. Error bars are not shown if it is within the boundaries of the symbol. Leg volume at time points were compared using a Mann-Whitney U test corrected for multiple comparisons using the Benjamini, Krieger, and Yekutieli method. *p < 0.0005. Every time point after zero is statistically significant.
(C) Allograft leg volume of C2C12-pcDNA3.1 control and C2C12-VGLL2NCOA2 after intramuscular injection into the leg of Swiss Nude mice. C2C12-pcDNA3.1 was injected in n = 10 allografts and C2C12-VGLL2NCOA2 was injected in n = 6 allografts. The error bars represent the mean leg volume ± SEM. Error bars are not shown if they are within the boundaries of the symbol. Tumor volume at time points were compared using a Mann-Whitney U test corrected for multiple comparisons using the Benjamini, Krieger, and Yekutieli method. *p < 0.0005. Every time point after zero is statistically significant.
(D) Representative hematoxylin-eosin saffron (HES) staining from a C2C12-pcDNA3.1 control allograft and a C2C12-VGLL2NCOA2 tumor allograft. Scale bars, 50 µm.
(E) Representative immunohistochemistry for Desmin, Myogenin, and Ki67 for C2C12-pcDNA3.1 control allograft and a C2C12-VGLL2NCOA2 tumor allograft. Scale bars, 50 µm.
(F) Arf6 mRNA levels from RNA-seq of allografts from Swiss Nude mice, including two C2C12-pcDNA3.1 controls and six C2C12-VGLL2NCOA2 tumors. Error bars represent mean ± SD. Arf6 mRNA expression was compared using a Welch’s t test.
(G) Representative immunohistochemistry for Arf6 protein levels in C2C12-pcDNA3.1 controls and C2C12-VGLL2NCOA2 tumors. Eleven C2C12-pcDNA3.1 controls and six C2C12-VGLL2NCOA2 tumor samples were analyzed. Results are presented in Table S4. Scale bars, 50 µm.