IMAGE

Fig. 1

ID
ZDB-IMAGE-230707-46
Source
Figures for Dinarello et al., 2023
Image
Figure Caption

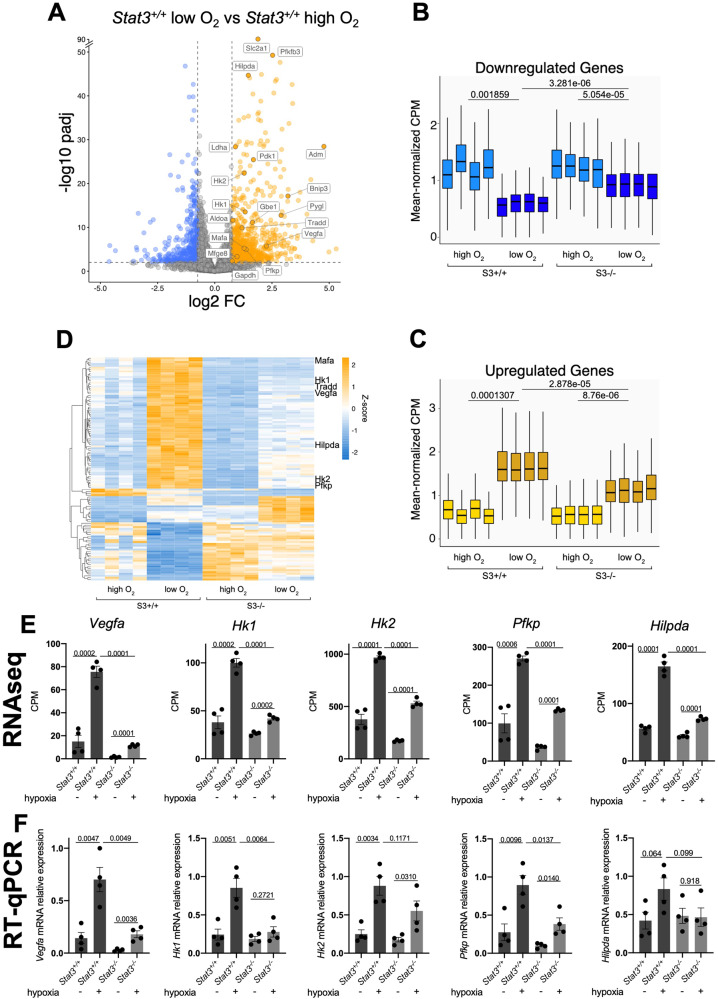
Fig. 1 STAT3 regulates a subset of hypoxia-dependent genes.

AD Transcriptome analysis by RNA-seq. A: Genes that were differentially expressed (log2[fold change (FC)] > + 0.75 or <−0.75; q-value < 0.01, Benjamini–Hochberg adjustment, as indicated by dashed lines) between Stat3+/+ cells in normoxia and Stat3+/+ cells in hypoxia; n = 4 biological replicates. Expression levels of genes that were down- (B) and upregulated (C) in Stat3+/+ in hypoxia relative to Stat3+/+ cells in normoxia. Each boxplot shows the 1st, 2nd and 3rd quartiles; the whiskers show the minimum and maximum values. D heatmap of RNAseq data reporting the expression of genes that are affected by hypoxia in Stat3+/+ cells compared to Stat3+/+ normoxic cells, but that require STAT3 to be properly altered in their expression. E expression level of Vegfa, Hk1, Hk2, Pfkp and Hilpda in normoxic and hypoxic Stat3+/+ and Stat3−/− mESCs taken from RNAseq data. F Gene expression analysis by RT–qPCR of Stat3+/+ and Stat3−/− cells treated in normoxic and hypoxic mESCs of the same genes shown for the RNAseq. Mean ± SEM of n = 4 experiments, with each replica shown as a dot.

Acknowledgments
This image is the copyrighted work of the attributed author or publisher, and ZFIN has permission only to display this image to its users. Additional permissions should be obtained from the applicable author or publisher of the image. Full text @ Cell Death Discov