Figure Caption
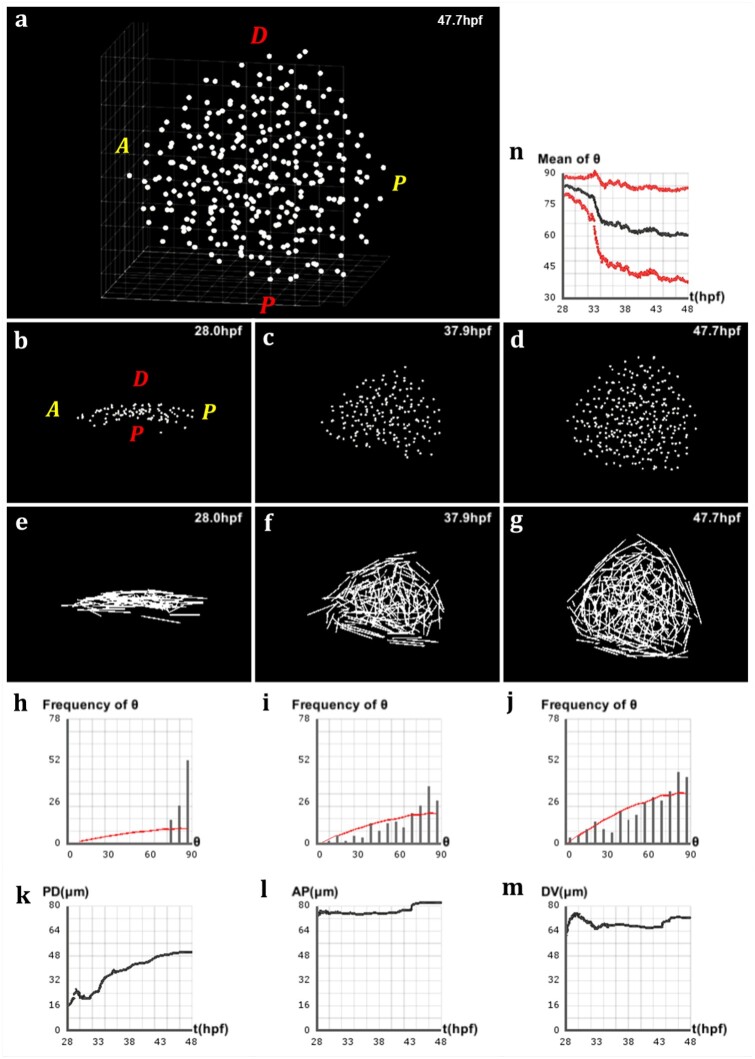
Simulation of pectoral fin morphogenesis based on directional cell behaviors. Values of the equation parameters: λ=0.2,ν=1.6,𝐽=0.001. (a) 3D view of the simulated fin at the final stage 𝑡=47.8 hpf. (b–d) Lateral view of the simulated fin at different stages of development, respectively 𝑡=28.0 hpf, 𝑡=37.9 hpf and 𝑡=47.7 hpf. (e–g) Vector field of the cells’ elongation axes 𝑒→Max𝑖 in the simulated fin at the same stages. (h–j) Distribution of the polarity angles θi of the cells in the simulated fin at the same stages, compared with the standard distribution of random angles formed by two arbitrary vectors in 3D (red curve). (k–m) Evolution over time of the simulated fin size in μm along the PD, AP and DV axes respectively. We observe roughly the same behavior as the real fin in Figure. 1h–j. (n) Evolution over time of the average polarity angle 𝜃⎯⎯ of the simulated fin cells ± its standard deviation Δθ shown in red. This curve is more scattered than Figure 4k