
|
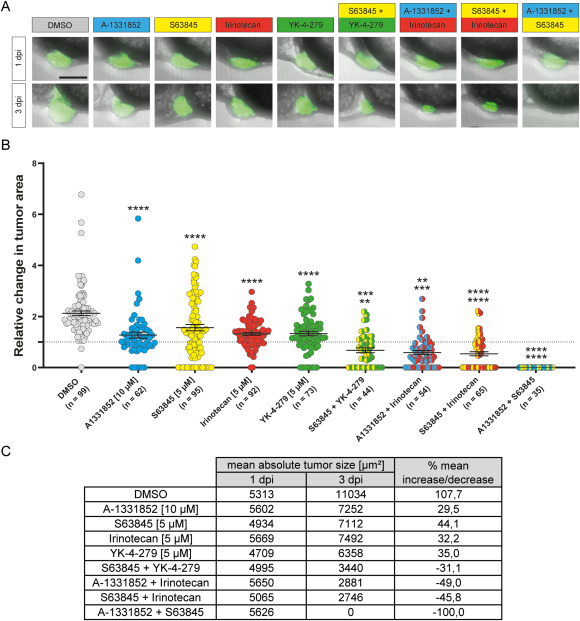
Fig. 4 Fig. 4. Combination treatments of xenotransplanted larvae Xenotransplanted larvae were treated with A-1331852 (10 μM), S63845 (5 μM), irinotecan (5 μM), YK-4-279 (5 μM) and respective combinations for 48 h (1 dpi - 3 dpi). A) Representative images for average change in tumor size for every condition. B) Relative change of tumor area (3 dpi/1 dpi). C) Mean absolute tumor sizes and percent changes. Scale bar is 125 μm. For evaluation, single treatments were compared to DMSO control and combination treatments were compared to respective single treatments (top significance value indicates comparison to first compound, bottom value indicates comparison to second compound). Statistical analyses were performed with a Kruskal-Wallis test, ****: p ≤ 0.0001, ***: p ≤ 0.001, **: p ≤ 0.01. Error bars represent SEM of combined larvae from two independent experiments.