
Fig. 4
- ID
- ZDB-IMAGE-230607-16
- Genes
- Publication
- Rayrikar et al., 2022 - Ccn2a-FGFR1-SHH signaling is necessary for intervertebral disc homeostasis and regeneration in adult zebrafish
- All Figures
- Figures for Rayrikar et al., 2022
|
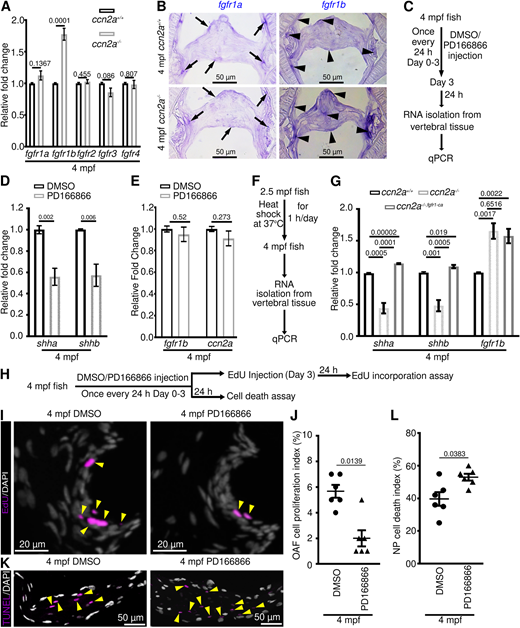
Fig. 4 FGFR1 signaling regulates shha and shhb expression, OAF cell proliferation, and NP cell survival in adult IVDs. (A) Quantification of FGFR expression in vertebral tissues (n=4). (B) fgfr1a and fgfr1b expression on sagittal sections of IVD. (C) Schematic of experimental procedures. (D,E) qPCR analysis of shha and shhb (D), and fgfr1b and ccn2a (E) expression in vertebral tissues (n=4). (F) Schematic of experimental procedures. (G) qPCR analysis of shha, shhb and fgfr1b expression in vertebral tissues (n=4). (H) Schematic of experimental procedures. (I) Maximum intensity projections (MIPs) of confocal images of sagittal IVD sections stained for EdU (magenta; proliferating cells) and stained with DAPI (white; nuclei). Arrowheads indicate EdU+ OAF cells. (J) Quantification of proliferating OAF cell (n=6). (K) MIPs of confocal images of sagittal IVD sections stained for TUNEL (magenta; dead cells) and stained with DAPI (white; nuclei). Arrowheads indicate TUNEL+ NP cells. (L) Dot plot showing the percentage of TUNEL+ NP cells (n=6). In A,D,E,G,J,L, data are mean±s.e.m.; each sample represents one animal. Mean Ct values can be found in Table S5.