
Fig. 2
- ID
- ZDB-IMAGE-230607-14
- Genes
- Publication
- Rayrikar et al., 2022 - Ccn2a-FGFR1-SHH signaling is necessary for intervertebral disc homeostasis and regeneration in adult zebrafish
- All Figures
- Figures for Rayrikar et al., 2022
|
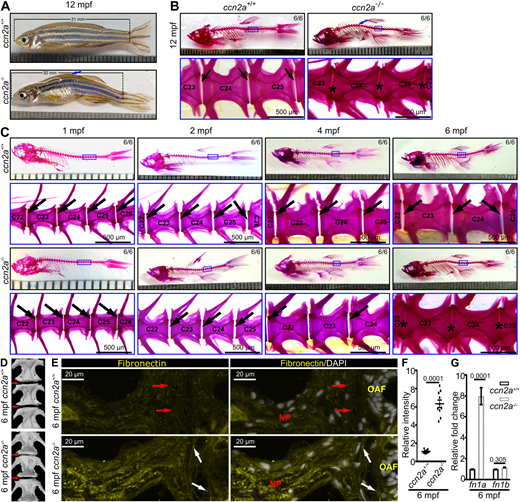
Fig. 2 ccn2a−/− exhibits IVDD in adult zebrafish. (A) Bright-field images. Arrow indicates the curvature in the body axis of ccn2a−/−. (B,C) Bright-field images of whole-mount AB/AR stained animals. Blue arrows in B indicate the curvature in the spine of ccn2a−/−. Black arrows indicate intervertebral gaps, which are not visible in ccn2a−/− at 6 mpf. (D) µCT images of zebrafish spine. Arrows indicate the intervertebral region. (E) Maximum intensity projections of confocal images of IVD sagittal sections immunostained for fibronectin (yellow) and stained with DAPI (white; nuclei). Red and white arrows indicate striated and fragmented fibronectin expression in the IAF of the wild-type and ccn2a−/− IVD, respectively. Increased fibronectin expression is visible in the ccn2a−/− IVD. (F) Quantification of E (n=10). The mean of the wild-type control value was set to 1. (G) Quantification of fn1a and fn1b expression in vertebral tissues (n=4). Mean Ct values can be found in Table S5. In F and G, data are mean±s.e.m.; each sample represents one animal. Digits on the images in B and C indicate the number of fish that showed the presented phenotype out of the total number of fish. ‘C’ on images in B and C represents centrum/vertebrae.