
IMAGE
Figure 1
- ID
- ZDB-IMAGE-230529-48
- Genes
- Publication
- Huang et al., 2023 - CRISPR/Cas9-Mediated Knockout of tnfaip1 in Zebrafish Plays a Role in Early Development
- All Figures
- Figures for Huang et al., 2023
Image
|
Figure Caption
Figure 1
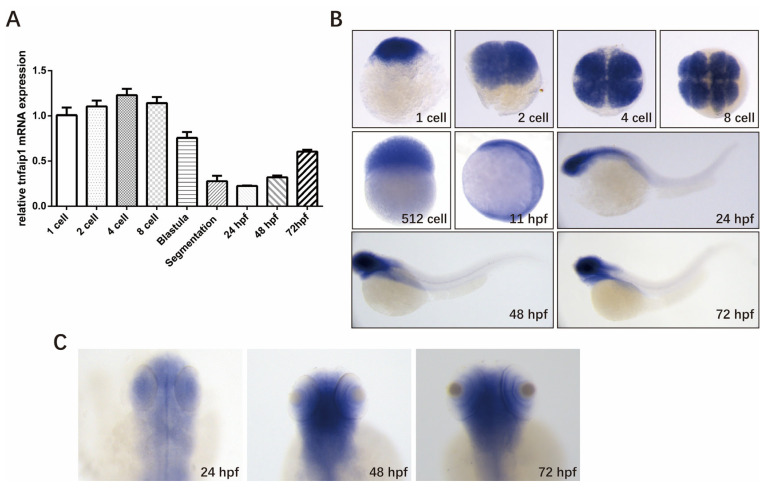
Spatio-temporal expression pattern of tnfaip1 in zebrafish during early development. (A) qPCR detection of the relative expression level of tnfaip1 mRNA during zebrafish embryo development, with 18SrRNA as an internal control. (B) Whole mount in situ hybridization to detect tnfaip1 expression during zebrafish embryo development. n = 15 per group; scale bar, 500 μm. (C) High magnification of tnfaip1 expression in zebrafish 24, 48, and 72 hpf anterior organs. n = 15 per group; scale bar, 250 μm.
Figure Data
Acknowledgments
This image is the copyrighted work of the attributed author or publisher, and
ZFIN has permission only to display this image to its users.
Additional permissions should be obtained from the applicable author or publisher of the image.
Full text @ Genes (Basel)