
|
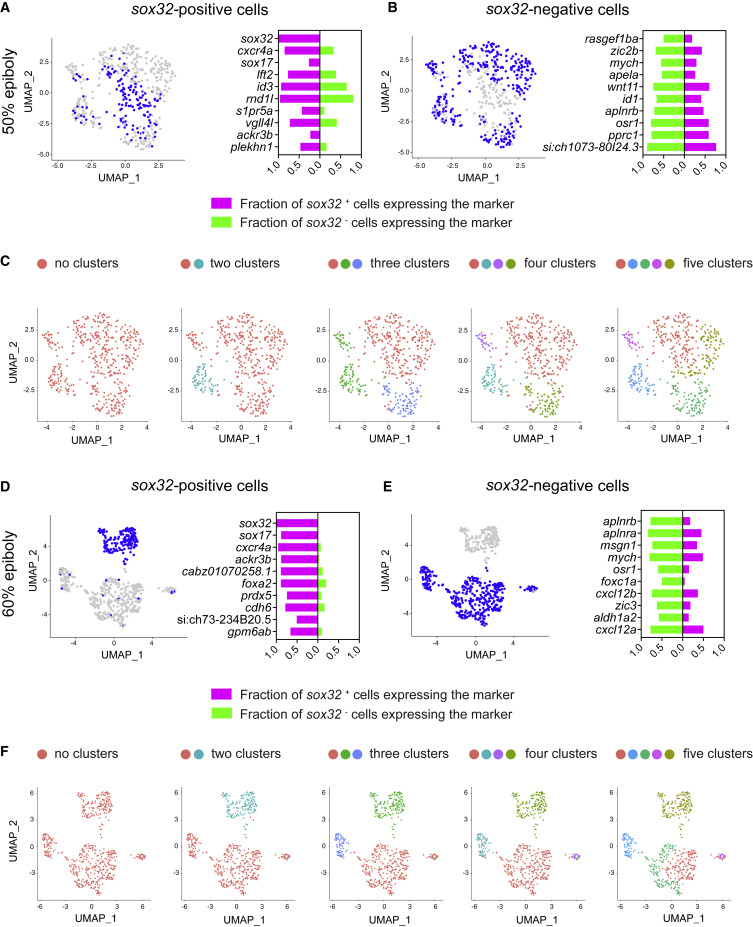
Fig. 5 Switching to an endodermal fate is not associated with suppression of mesodermal fate
(A) Left: uniform manifold approximation and projection (UMAP) visualization of gata5-positive cells derived from 50% epiboly stage embryos. Blue cells are those expressing at least one read count for sox32. Right: stacked bar plot showing the pct (percentage of expressing cells) for the top 10 genes differentially expressed in sox32-positive cells (magenta) compared to the pct for the same genes in sox32-negative cells (green).
(B) Left: as in (A), but blue cells are those expressing less than one read count for sox32. Right: stacked bar plot showing the pct for the top 10 genes differentially expressed in sox32-negative cells (green) compared to the pct for the same genes in sox32-positive cells (magenta).
(C) UMAP visualization of gata5-positive cells at 50% epiboly. Cells were clustered with increasing granularity across five iterations, Find cluster resolution = 0.1 to 0.5. Color coding refers to the different clusters.
(D) As in (A), but for 60% epiboly embryos.
(E) As in (B), but for 60% epiboly embryos.
(F) As in (C), but for 60% epiboly embryos, Find cluster resolution = 0.01 to 0.5.
See also Figures S5 and S6.
Reprinted from Developmental Cell, 57, Economou, A.D., Guglielmi, L., East, P., Hill, C.S., Nodal signaling establishes a competency window for stochastic cell fate switching, 26042622.e52604-2622.e5, Copyright (2022) with permission from Elsevier. Full text @ Dev. Cell