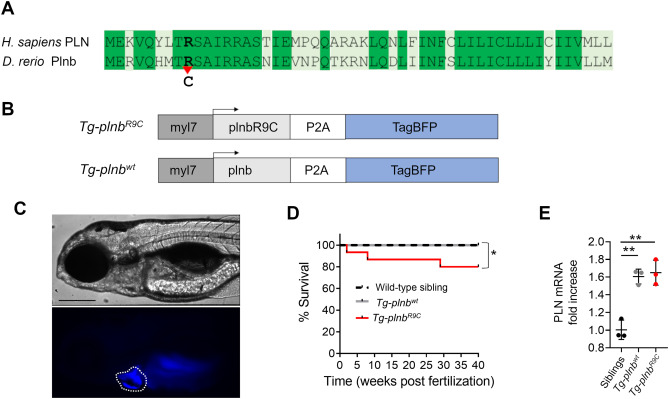
Fig. 1 Generation of Tg-plnbwt and Tg-plnbR9C zebrafish lines. A) Alignment of the human PLN and zebrafish Plnb protein sequences. Identical amino acids are indicated in dark green. The bold type indicates the Arg9Cys mutation point. B) myl7:plnbR9C-P2A-TagBFP and myl7:plnb-P2A-TagBFP transgenes flanked by Tol2 sequences (not shown in the scheme). C) Transmitted and fluorescence images of a representative 4 dpf Tg-plnbR9C zebrafish larva showing the expression of TagBFP in the heart. The scale bar represents 200 μm. D) Kaplan-Meier curve showing the survival of wild-type siblings, Tg-plnbwt and Tg-plnbR9C fish up to 40 weeks. A Log-rank (Mantel-Cox) test was used. E) Quantitative PCR plot showing the relative expression levels of plnb in 3 dpf Tg-plnbwt and Tg-plnbR9C larvae, compared to wild-type siblings (n = 3 pools of ten hearts each). GADPH was used for normalization. Statistical analysis was performed using a one-way ANOVA test with Tukey's multiple comparisons post-test. (* p < 0.05, ** p < 0.01). (For interpretation of the references to colour in this figure legend, the reader is referred to the web version of this article.)
Reprinted from Journal of Molecular and Cellular Cardiology, 173, Vicente, M., Salgado-Almario, J., Valiente-Gabioud, A.A., Collins, M.M., Vincent, P., Domingo, B., Llopis, J., Early calcium and cardiac contraction defects in a model of phospholamban R9C mutation in zebrafish, 127-140, Copyright (2022) with permission from Elsevier. Full text @ J. Mol. Cell. Cardiol.

