
|
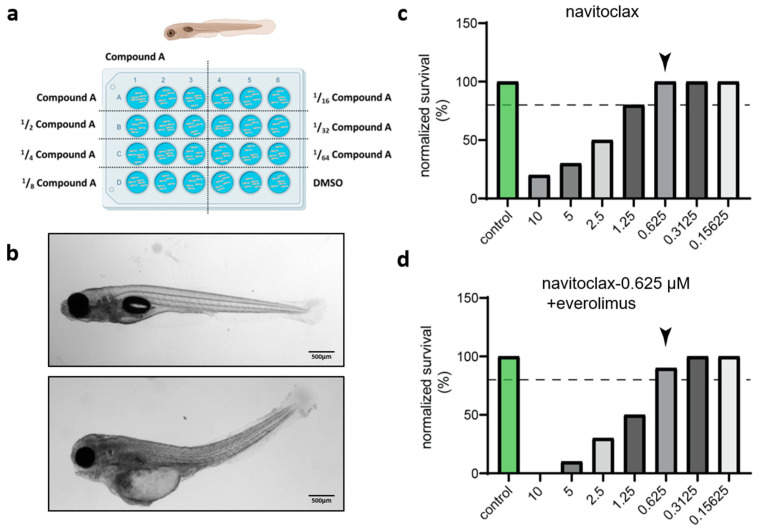
Figure 4
The maximum tolerated dose (MTD) of drug in the wild-type zebrafish. (a) Schematic diagram of the experimental set up for drug toxicity in wild-type zebrafish embryos: drug administration (3–7 dpf) and measurement of MTD (8 dpf). (b) Representative images of normal (top) and malformed (bottom) zebrafish larvae at 8 dpf. (c) The dotted line denotes the 80% survival rate used as a cut-off for the establishment of the MTD. The survival of zebrafish treated with navitoclax top exceeded 80% at concentration below 0.625 µM. The black arrow indicates the MTD of navitoclax (0.625 µM). (d) The black arrow indicates the MTD of navitoclax (0.625 µM) + everolimus (0.625 µM) when treated through bath submersion administration.