
Figure 6
- ID
- ZDB-IMAGE-230430-35
- Genes
- Publication
- Niu et al., 2023 - vwa1 Knockout in Zebrafish Causes Abnormal Craniofacial Chondrogenesis by Regulating FGF Pathway
- All Figures
- Figures for Niu et al., 2023
|
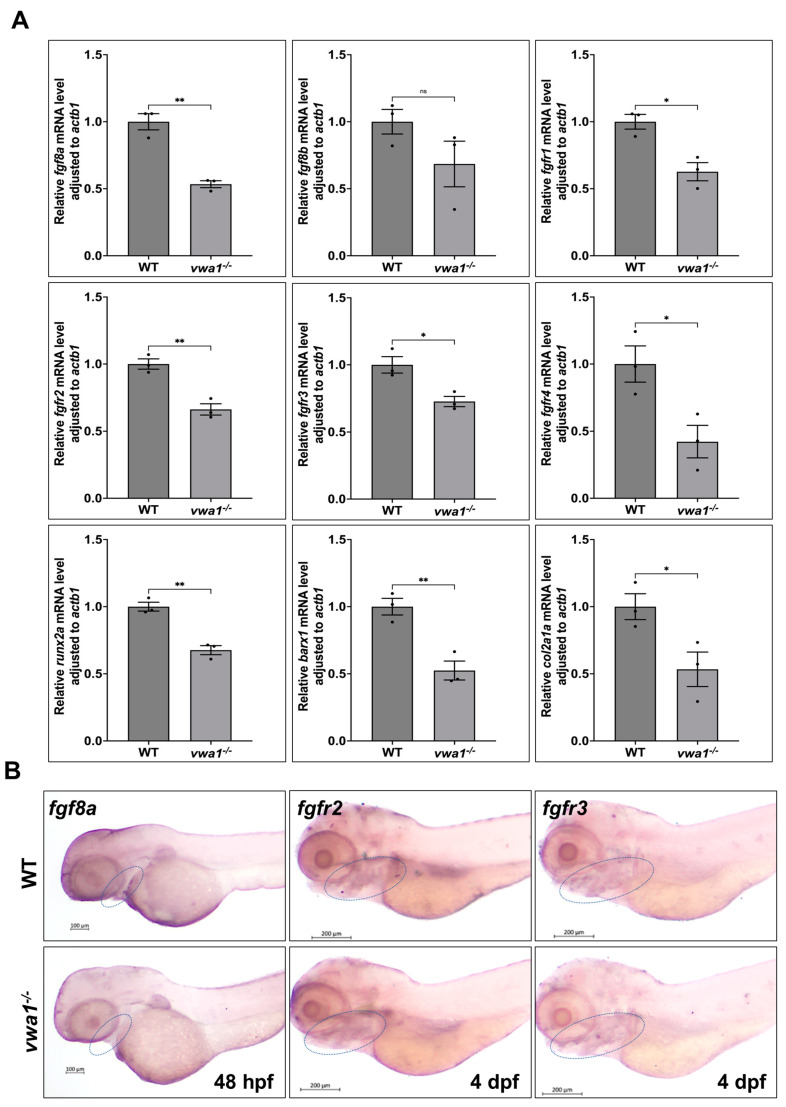
Figure 6
vwa1 regulates FGF signaling in the pharyngeal region. (A) RT-qPCR analysis of the mRNA levels of fgf8a, fgf8b, fgfr1, fgfr2, fgfr3, fgfr4, runx2a, barx1, and col2a1a in vwa1−/− zebrafish, showing that all of these FGF signaling pathway components except for fgf8b were decreased in vwa1 mutants. Relative transcription levels were calculated as fold change using the 2−ΔΔCt method. (B) WISH staining of fgf8a, fgfr2, and fgfr3 in vwa1 mutant embryos and WT controls showed that fgf8a, fgfr2, and fgfr3 expression were all reduced in mutant embryos. The mandibular region is marked with dotted blue circles. Figure S2 Apoptosis did not significantly increase in vwa1−/− mutants at 30 and 48 hpf. (A,B) TUNEL assay (red fluorescence) at 30 hpf demonstrated similar amount of apoptosis cells in the cranial region and dorsal tissues of wildtype controls (WT) and mutants. (C,D) TUNEL assay (red fluorescence) at 48 hpf showed similar level of apoptosis in WT and mutants. * p < 0.05; ** p < 0.01.