
|
Figure 5
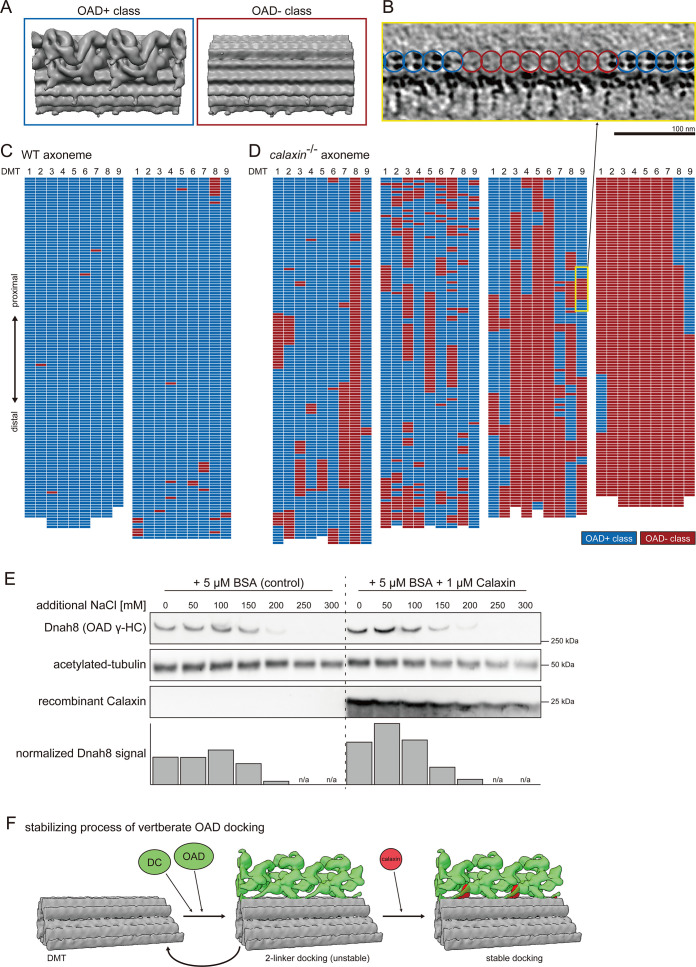
(A–D) Structural classification sorted the 24 nm repeat units of DMT into OAD+ class (blue) and OAD- class (red). (A) Averaged structures of each class. (B) Tomographic slice shows the side view of DMT. Blue or red circles indicate the class of each 24 nm repeat unit of DMT. Scale bar: 100 nm. (C–D) Distribution patterns of each class. 24 nm repeat units on each DMT are schematically displayed as individual colored grids. (C) Two typical tomograms of WT axoneme. (D) Four typical tomograms of calaxin-/- axoneme. Yellow square indicates the region displayed in B. (E) Immunoblot of calaxin-/- sperm axonemes incubated with or without recombinant Calaxin protein in different salt concentration buffers. Bottom row shows the bar graph of Dnah8 signals, normalized by the amount of acetylated tubulin signals. (F) Model of the stabilizing process of vertebrate OAD docking onto DMT.
Calaxin is required for the stable docking of OAD onto DMT.