
|
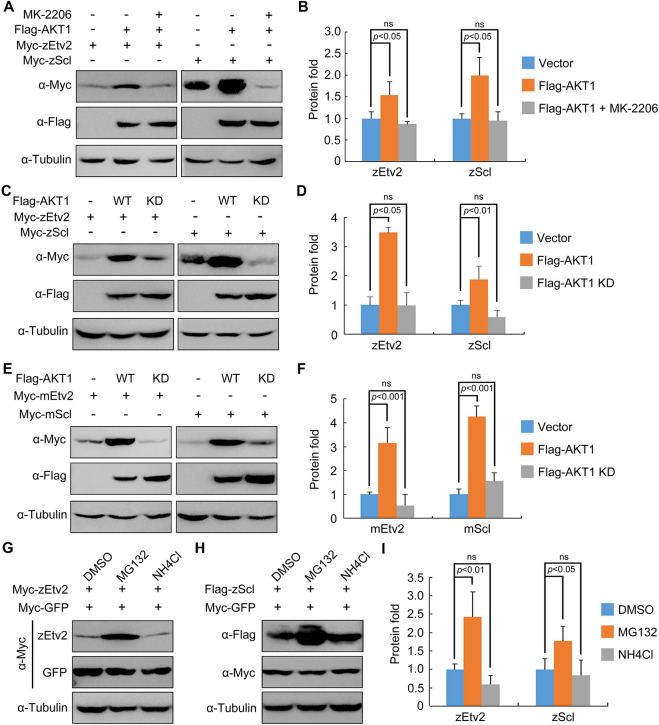
Fig. 5.
AKT stabilizes zEtv2 and zScl through its kinase activity. (A,B) HEK293T cells were co-transfected with plasmids expressing Flag-AKT1 and Myc-zEtv2 or -zScl, and treated with either DMSO or 0.5 μM MK-2206 for 24 h before undergoing western blot analysis. (C,D) Overexpression of wild-type (WT) AKT1 but not its kinase-deficient (KD) mutant stabilizes zEtv2 and zScl. (E,F) The promotion of mEtv2 or mScl expression level by AKT1 is dependent on its kinase activity. (G-I) zEtv2 and zScl proteins are degraded through the proteasome pathway. HEK293T cells co-transfected with plasmids encoding either Myc-zEtv2 or Flag-zScl and the negative control Myc-GFP were treated with either the lysozyme inhibitor NH4Cl (20 mM) or the proteasomal inhibitor MG132 (20 μM) for 5 h before harvest. In B,D,F,I, the gray values of the immunoreactive protein bands were quantified using ImageJ. Graphs show the density of the indicated protein signals relative to the corresponding Tubulin signals (mean±s.d., three independent biological repeats). Paired Student's t-test; ns, not significant.