
|
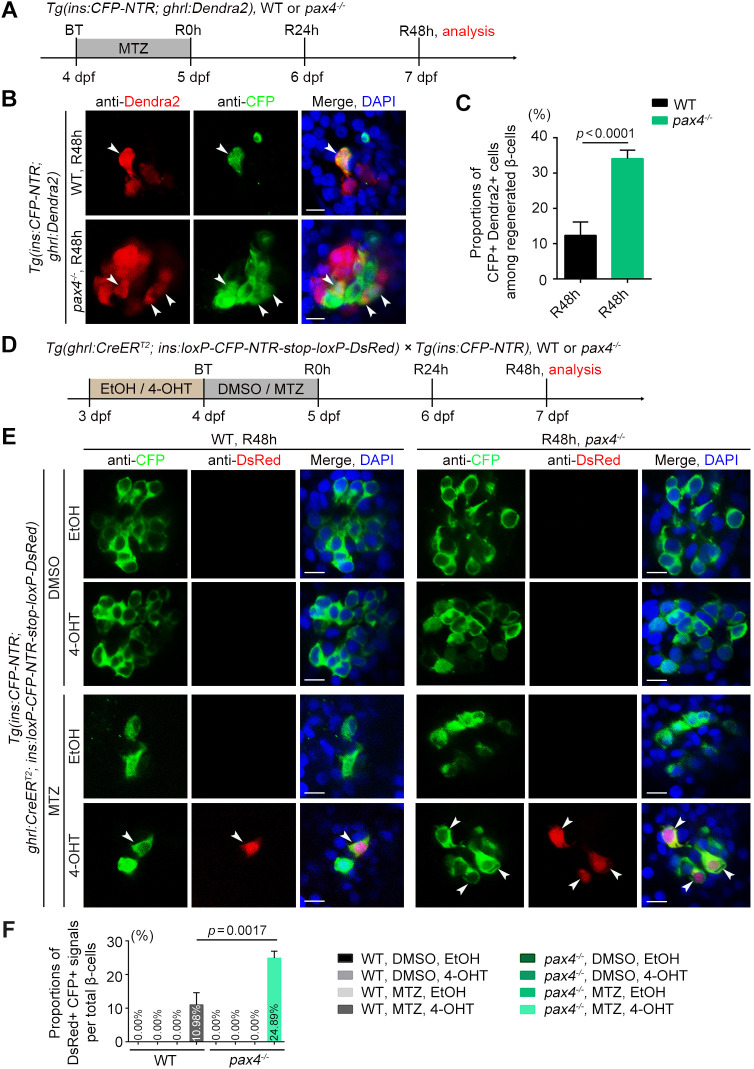
Fig. 3.
Deletion of Pax4 causes the increased proportion of ε-cells converting to β-cells during β-cell regeneration. (A) Experimental scheme for MTZ treatment of the wild-type or pax4−/− mutant under the Tg(ins:CFP-NTR; ghrl:Dendra2) double transgenic background. (B) More neogenic CFP+ β-cells overlapped with the Dendra2+ ε-cells in pax4−/− mutant relative to the wild-type MTZ-treated group. Arrowheads indicate CFP+ Dendra2+ double-positive cells. (C) Statistical diagram of proportions of CFP+ Dendra2+ double-positive cells among regenerated β-cells (n=25). (D) Experimental scheme for DMSO, MTZ, ethanol or 4-OHT treatment of the wild-type or pax4−/− mutant under Tg(ghrl:CreERT2; ins:loxP-CFP-NTR-stop-loxP-DsRed; ins:CFP-NTR) triple transgenic background. (E) Antibody staining of CFP and DsRed after 48 h of regeneration (R48 h) showed an increased proportion of DsRed-labelled cells (arrowheads) in the pax4−/− MTZ- and 4-OHT-treated group compared with the wild-type group. (F) The proportions of DsRed+ CFP+ signals per total β-cells (n=22). All statistical data are expressed as mean±s.e.m. P-values were calculated using an unpaired Student's t-test. Scale bars: 10 µm.