
|
Fig. 1.
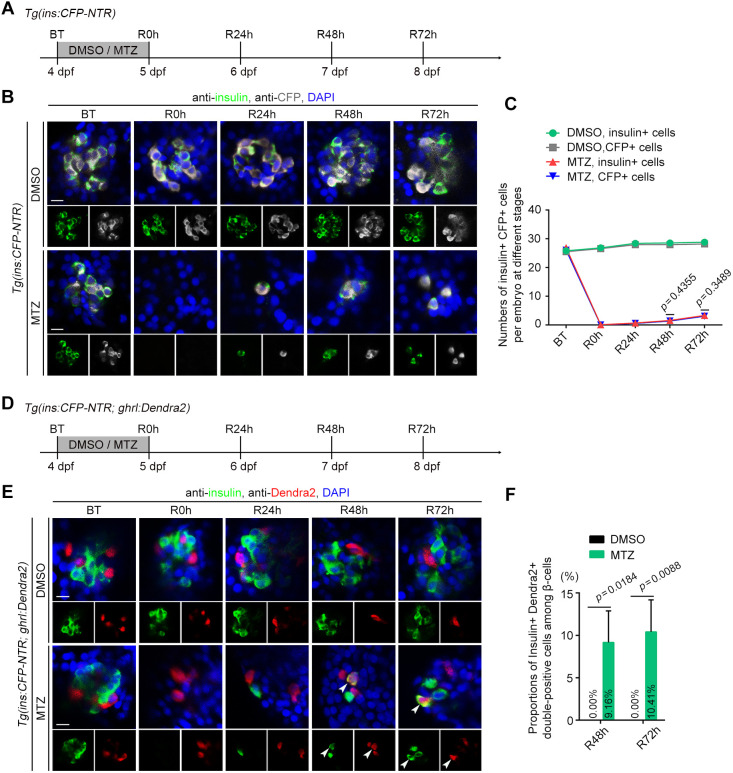
A small proportion of ghrelin-positive ε-cells express insulin after near-total β-cell ablation. (A) Experimental scheme for DMSO or MTZ treatment of the Tg(ins:CFP-NTR) larvae. (B) Antibody staining of insulin and CFP showed that pancreatic β-cells in zebrafish regenerated slowly after near-total ablation. (C) The numbers of insulin+ and CFP+ cells per embryo at different stages (n=22). (D) Experimental scheme for DMSO or MTZ treatment of the Tg(ins:CFP-NTR; ghrl:Dendra2) larvae. (E) A small proportion of ε-cells expressed insulin during β-cell regeneration. Arrowheads indicate CFP+ Dendra2+ double-positive cells. (F) Statistical diagram of proportions of insulin+ Dendra2+ double-positive cells among β-cells (n=20, the average percentage is shown in the histogram). All statistical data are expressed as mean±s.e.m. P-values were calculated using an unpaired Student's t-test. Scale bars: 10 µm. BT, before treatment; R0 h, R24 h, R48 h and R72 h indicate regeneration for 0, 24, 48 and 72 h, respectively.