
|
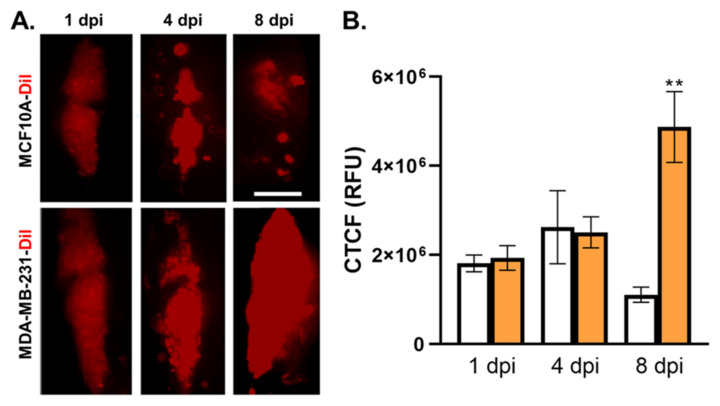
Figure 3
MDA-MB-231 TNBC cells exhibited increased tumor area in the zebrafish hindbrain ventricle compared to noncancerous breast tissue cells. (A). Top row: images of noncancerous breast tissue MCF10A xenograft cells treated with DiI in the hindbrain ventricle at 1, 4, and 8 dpi; bottom row: images of cancerous breast tissue MDA-MB-231 xenograft cells treated with DiI in the hindbrain ventricle at 1, 4, and 8 dpi. (B). Comparison of MCF10A (white columns) and MDA-MB-231 (orange columns) corrected total cell fluorescence values at 1, 4, and 8 dpi. Key: days postinjection (dpi); corrected total cell fluorescence (CTCF); relative fluorescence units (RFU); p < 0.05, “**” = 0.01; Error bars = SEM; scale bar = 100 µm; N for MCF10A: 27 (1 dpi), 30 (4 dpi), 33 (8 dpi); N for MDA-MB-231: 27 (1 and 4 dpi), 35 (8 dpi).