
|
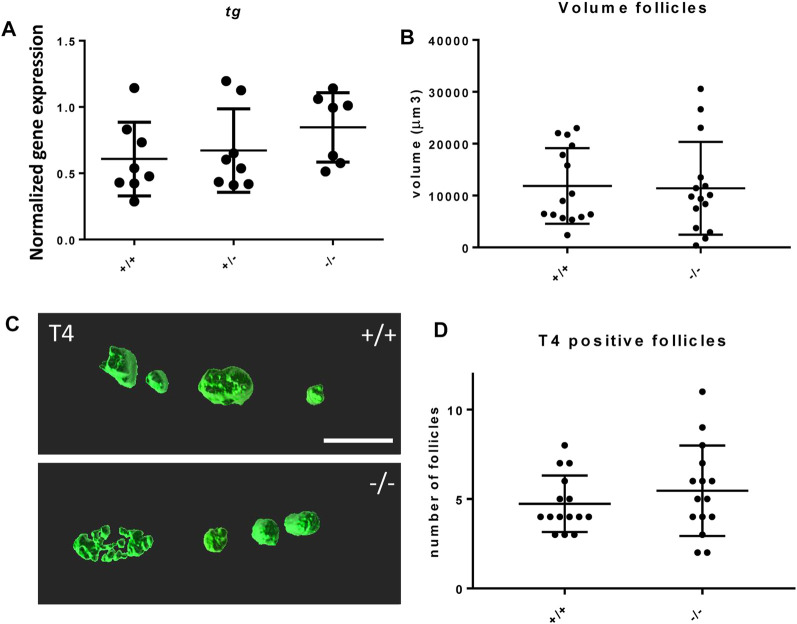
FIGURE 6
Thyroid follicle development in foxe1 mutants. (A) Normalized gene-expression of thyroid marker thyroglobulin during early development (3 dpf). (B, D) Analysis of T4 positive follicles by whole mount immunohistochemistry in 6 dpf larvae showed no difference in mean follicle count or volume. (C) Representative images of wild type and mutant thyroid follicles. Larvae were imaged from the ventral side and T4-positive follicle surfaces were rendered from z-stack images using Imaris 9.0 as previously described (Zhang et al., 2021). Scale bar 200 µm. (D) Data were assessed for normality with the D’Agostino-Pearson normality test. Normally distributed data were analyzed for statistical differences using a one-way ANOVA and post hoc Tukey test or unpaired t-test. Non-parametric data were compared with a Kruskal–Wallis test with post hoc Dunn’s Multiple comparison test or Mann-Whitney test. Error bars indicate standard deviation.