
Figure 6
- ID
- ZDB-IMAGE-230330-24
- Genes
- Publication
- Sobah et al., 2023 - Socs3b regulates the development and function of innate immune cells in zebrafish
- All Figures
- Figures for Sobah et al., 2023
|
Figure 6
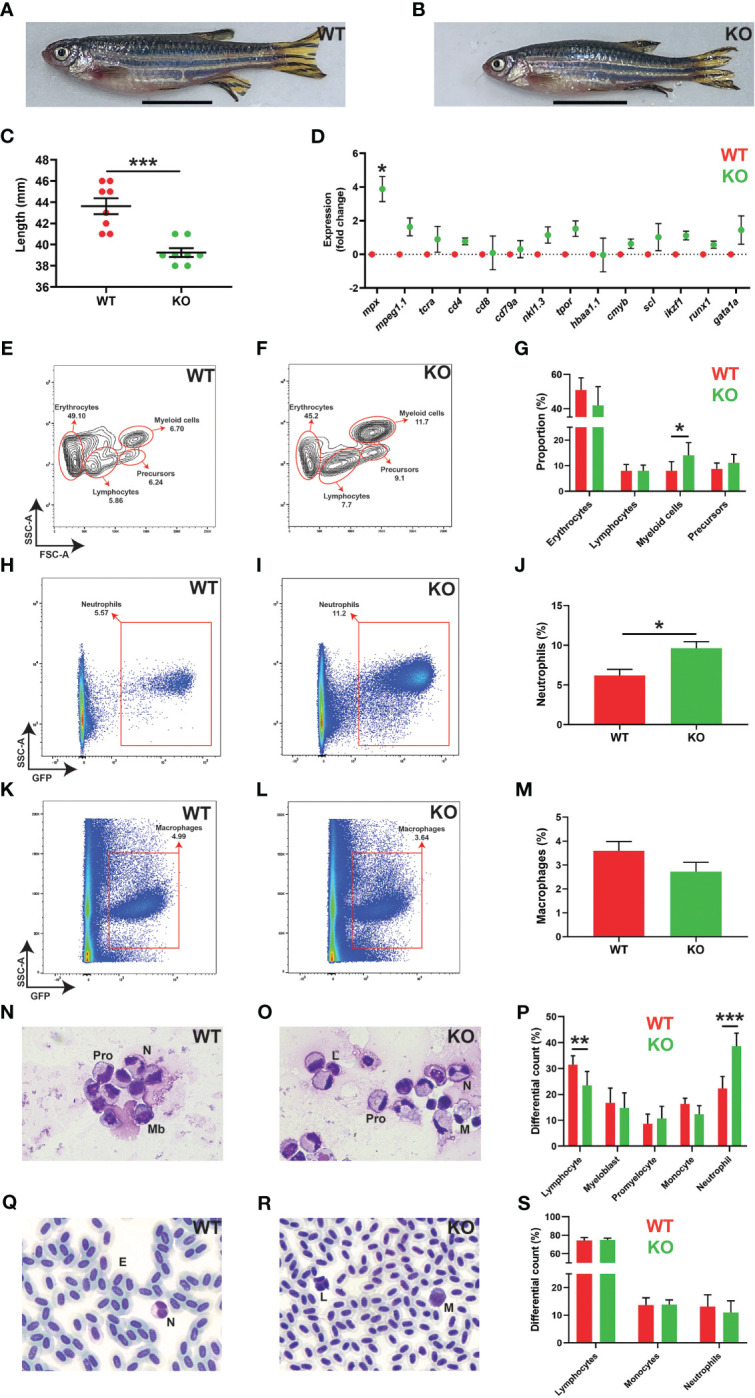
Effects of socs3b ablation on adult development and hematopoiesis. Representative images of wildtype (WT, socs3bwt/wt) and knockout (KO, socs3bmdu24/mdu24) zebrafish at 5 months post fertilization (mpf) (A, B), with scale bars representing 1 cm, along with quantitation of their size showing results for individual fish along with mean and SEM, with significance tested using a parametric t-tests (n = 8) (C). Gene expression analysis of the indicated genes in WT and KO adult kidney presented as fold change (log2) relative to WT, showing mean and SEM. Normalized Cq values obtained from WT and KO kidney marrow was used to test for significance using parametric t-tests (n = 6) (D). Flow cytometry analysis of WT and KO kidney for erythrocyte, lymphocyte, myeloid cell and precursor (E, F) populations, with analysis of mpx+ neutrophils (H, I) and mpeg1.1+ macrophages (K, L) as well as quantitation of relevant populations (G, J, M) showing mean and SEM with significance tested using t-tests with Welch’s correction (n = 10) (*** p < 0.001, ** p < 0.01, * p < 0.05). Histological analysis of adult kidney (N, O) and blood (Q, R), showing representative images, as well as quantitation of both (P, S), showing mean and SEM, a parametric t-tests (n = 6 and n = 8, respectively) (F). Mb, myeloblast; Pro, promyelocyte; M, monocyte; L, lymphocyte; N, neutrophil; E, erythrocyte.