Figure Caption
Figure 8
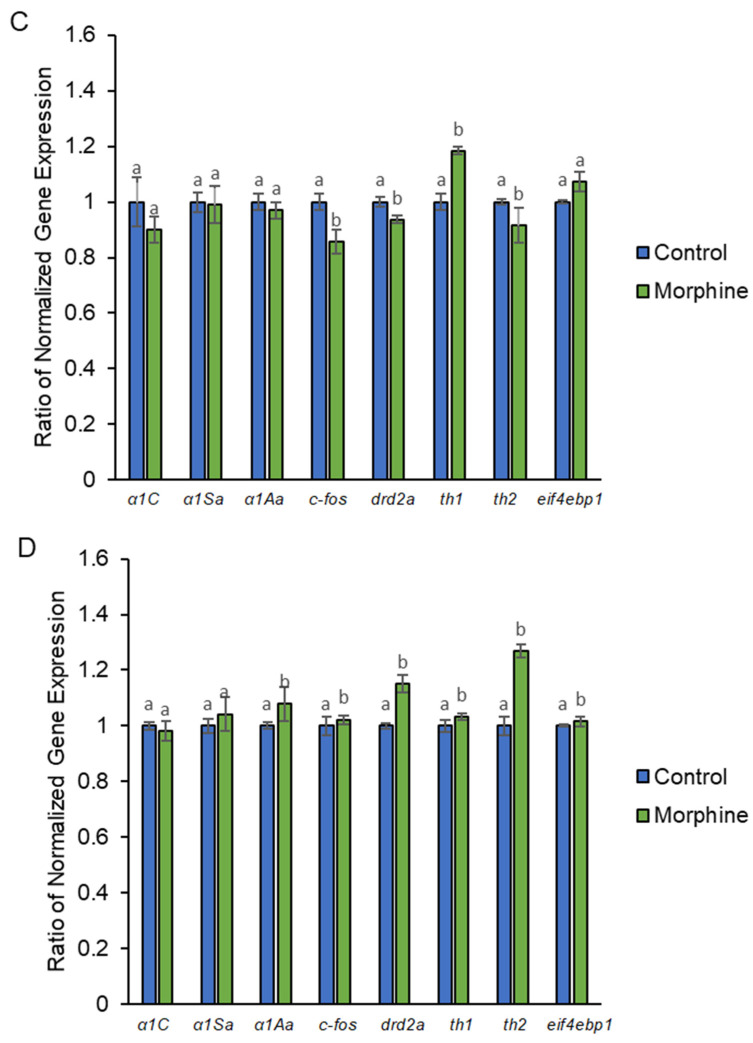
Altered gene expression in zebrafish larvae following exposure to MK801, DMP, and morphine. (A) Short-term effect on expression of α1C (F (3, 32) = 1.62, p = 0.91), α1Sa (F (3, 32) = 1.57, p = 0.22), α1Aa (F (3,32) = 1.99, p = 0.13), c-fos (F (3, 32) = 1.50, p = 0.67), drd2a (F (3, 32) = 53.34, p = 0.00), th1 (F (3, 32) = 6.18, p = 0.02), th2 (F (3, 32) = 283.76, p = 0.00), and eif4ebp1 (F (3, 32) = 25.18, p = 0.00). (B) Long-term effect on expression of α1C (F (3,32) = 7.06, p = 0.00), α1Sa (F (3, 32) = 15.60, p = 0.00), α1Aa (F (3, 32) = 25.45, p = 0.00), c-fos (F (3,32) = 10.22, p = 0.01), drd2a (F (3, 32) = 264.97, p = 0.00), th1 (F (3, 32) = 292.13, p = 0.00), th2 (F (3, 32) = 617.59, p = 0.00), and eif4ebp1 (F (3,32) = 20.76, p = 0.00). (C) Effect of morphine withdrawal of short-term morphine treatment on α1C (t (16) = 0.19, p = 0.66), α1Sa (t (16) = 1.13, p = 0.06), α1Aa (t (16) = 3.84, p = 0.10), c-fos (t (16) = 6.54, p = 0.02), drd2a (t (16) = 42.67, p = 0.00), th1 (t (16) = 54.81, p = 0.00), th2 (t (16) = 0.81, p = 0.38), and eif4ebp1 (t (16) = 11.33, p = 0.00). (D) Effect of morphine withdrawal after long-term morphine treatment on α1C (t (16) = 0.69, p = 0.42), α1Sa (t (16) = 2.97, p = 0.10), α1Aa (t (16) = 24.37, p = 0.00), c-fos (t (16) = 7.49, p = 0.01), drd2a (t (16) = 18.02, p = 0.00), th1 (t (16) = 18.11, p = 0.01), th2 (t (16) = 28.78, p = 0.00), and eif4ebp1 (t (16) = 8.10, p = 0.01). Data expressed as mean ± SEM, n = 50 of 3 independent experiments. Different alphabets indicate statistically significant values, p < 0.05. Drug abbreviation: DMP, domperidone.
Acknowledgments
This image is the copyrighted work of the attributed author or publisher, and
ZFIN has permission only to display this image to its users.
Additional permissions should be obtained from the applicable author or publisher of the image.
Full text @ Int. J. Mol. Sci.