
|
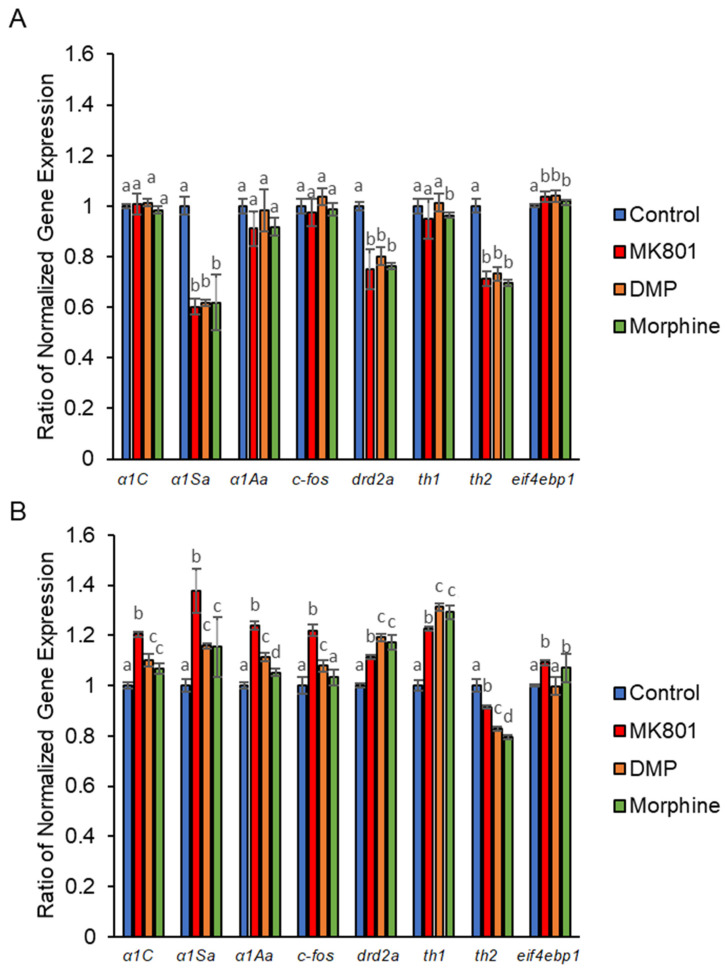
Figure 8
Altered gene expression in zebrafish larvae following exposure to MK801, DMP, and morphine. (A) Short-term effect on expression of α1C (F (3, 32) = 1.62, p = 0.91), α1Sa (F (3, 32) = 1.57, p = 0.22), α1Aa (F (3,32) = 1.99, p = 0.13), c-fos (F (3, 32) = 1.50, p = 0.67), drd2a (F (3, 32) = 53.34, p = 0.00), th1 (F (3, 32) = 6.18, p = 0.02), th2 (F (3, 32) = 283.76, p = 0.00), and eif4ebp1 (F (3, 32) = 25.18, p = p = 0.00), α1Sa (F (3, 32) = 15.60, p = 0.00), α1Aa (F (3, 32) = 25.45, p = 0.00), c-fos (F (3,32) = 10.22, p = 0.01), drd2a (F (3, 32) = 264.97, p = 0.00), th1 (F (3, 32) = 292.13, p = 0.00), th2 (F (3, 32) = 617.59, p = 0.00), and eif4ebp1 (F (3,32) = 20.76, p = 0.00). (C) Effect of morphine withdrawal of short-term morphine treatment on α1C (t (16) = 0.19, p = 0.66), α1Sa (t (16) = 1.13, p = 0.06), α1Aa (t (16) = 3.84, p = 0.10), c-fos (t (16) = 6.54, p = 0.02), drd2a (t (16) = 42.67, p = 0.00), th1 (t (16) = 54.81, p = 0.00), th2 (t (16) = 0.81, p = 0.38), and eif4ebp1 (t (16) = 11.33, p = 0.00). (D) Effect of morphine withdrawal after long-term morphine treatment on p = 0.10), α1Aa (t (16) = 24.37, p = 0.00), c-fos (t (16) = 7.49, p = 0.01), drd2a (t (16) = 18.02, p = 0.00), th1 (t (16) = 18.11, p = 0.01), th2 (t (16) = 28.78, p = 0.00), and eif4ebp1 (t (16) = 8.10, p = 0.01). Data expressed as mean ± SEM, n = 50 of 3 independent experiments. Different alphabets indicate statistically significant values, p < 0.05. Drug abbreviation: DMP, domperidone.