
|
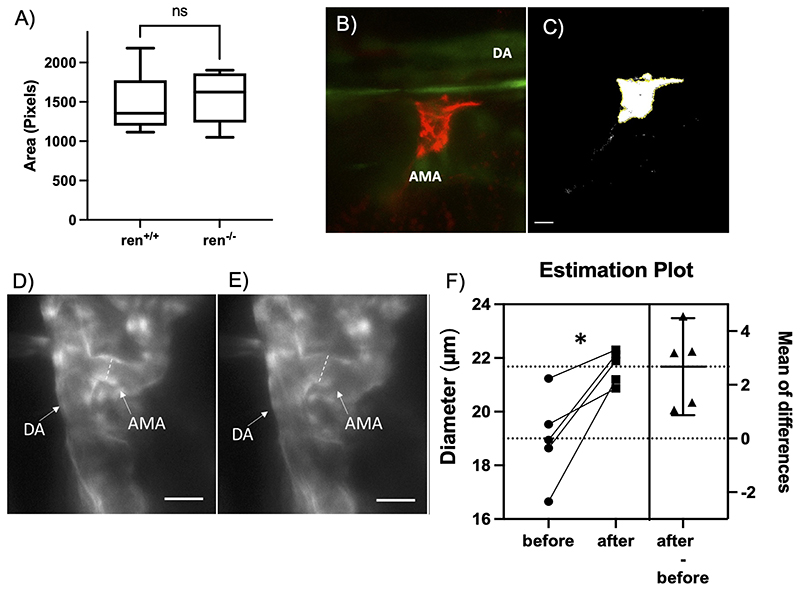
Fig. 1
A) Quantification of the LifeActRFP fluorescent signal at the AMA in Tg(ren:LifeAct-RFP;acta2:EGFP) 5dpf larvae on a ren +/+ or ren -/- background (n=5 per group); B) SPIM microscopy of pronephric AMA showing LifeActRFP (Ren-expressing cells) and EGFP (Acta2-expressing cells) fluorescence and C) representative greyscale image for mean area analysis. Laser ablation of renin-expressing cells in the AMA of Tg(ren:mem-KillerRed) 3dpf larvae showing kdrl:GFP signals at D) t = 0min and E) t = 60mins of the ablation protocol. The dorsal aorta (DA) can be seen with the anterior mesenteric artery (AMA) budding off it. Images represent single axial planes. Scale bars represent 30μm; AMA diameter was measured at the same two locations for each fish (dotted lines); F) An Estimation plot and mean of differences are shown; (Paired t-test*: p = 0.0147)