
|
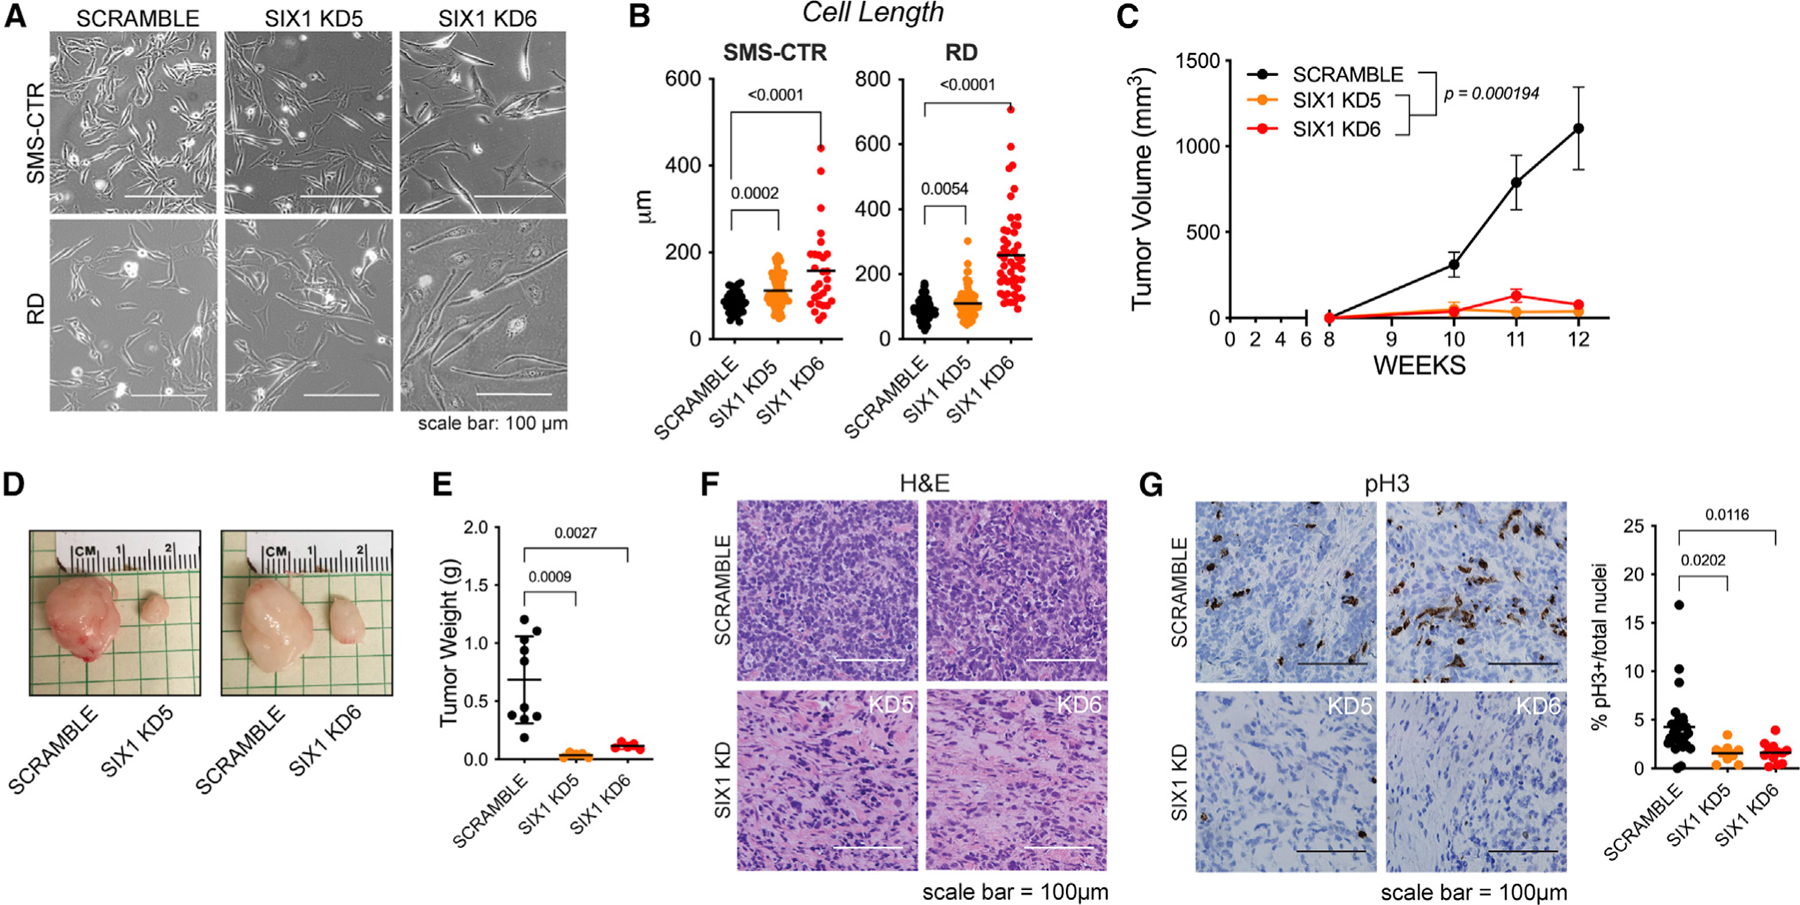
Fig. 3
(A and B) Bright-field images depicting the elongated cell morphology of SIX1 KD SMS-CTR and RD cells (A) and quantification of cell length (B). Statistical differences were calculated using one-way ANOVA followed by Dunnett’s multiple comparisons post hoc test.
(C) Tumor volumes, measured by caliper, over 12-weeks for Scramble and SIX1 KD SMS-CTR cells that were engrafted into the flanks of NSG mice. Data were fitted to a longitudinal mixed-effects model for statistical analysis of Scramble and SIX1 KD samples. Error bars represent mean ± SD at each time point.
(D) Representative images of dissected Scramble or SIX1 KD xenografted tumors at 12 weeks.
(E) Final tumor weights in grams at the end of the study (n = 10 mice total). Statistical differences were calculated using one-way ANOVA followed by Dunnett’s multiple comparisons post hoc test.
(F) Representative H&E histology of dissected Scramble and SIX1 KD xenografted tumors (n = 5 tumors/KD).
(G) Representative pH3 immunostaining (brown) of dissected Scramble and SIX1 KD xenografted tumors. Dots in the graph represent the percentage of pH3+ cells per tumor section; pH3 staining was quantified over 2 sections per tumor. Statistical differences were calculated using one-way ANOVA followed by Dunnett’s multiple comparisons post hoc test.