
Fig. 4.
- ID
- ZDB-IMAGE-230217-147
- Genes
- Publication
- Allers et al., 2023 - Loss of Shp1 impairs myeloid cell function and causes lethal inflammation in zebrafish larvae
- All Figures
- Figures for Allers et al., 2023
|
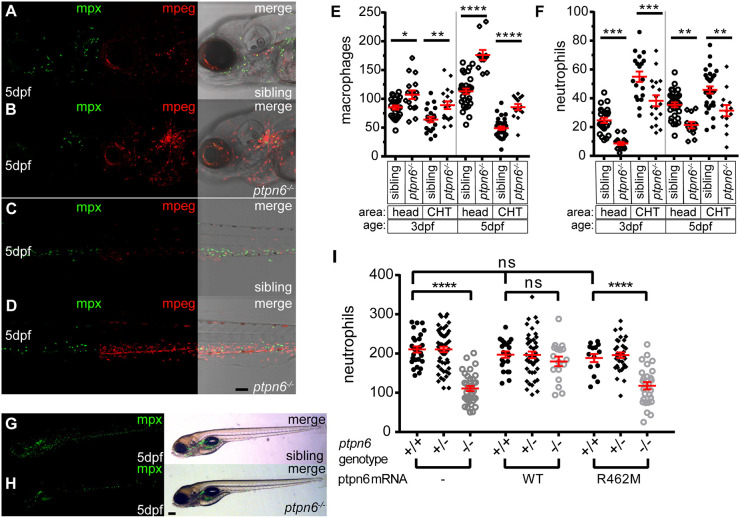
Fig. 4.
Zebrafish ptpn6 mutants have an increased number of macrophages and a reduced number of neutrophils, and this phenotype is dependent on the phosphatase activity of Shp1. (A-D) Representative pictures of the head area (A,B) and of the anterior part of the CHT (C,D) of 5 dpf tg(mpx:GFP/mpeg:mCherry) ptpn6 mutant and sibling embryos showing neutrophils and macrophages. Images were acquired using a 20× objective, a pinhole of 2 Airy units (AU) and a step size of 1.83 µm. (E,F) Quantification of macrophage (E) and neutrophil (F) numbers per embryo in the head and CHT of 3 and 5 dpf embryos, performed in ImageJ by particle analysis. Statistical comparisons by one-way ANOVA and Sidak's multiple comparison test for preselected columns. (G,H) Stereo images of 5 dpf tg(mpx:GFP) WT and ptpn6−/− non-injected embryos. Images of WT Shp1- and Shp1-R462M-injected embryos are shown in Fig. S4. (I) Quantification of the total number of neutrophils in tg(mpx:eGFP) embryos injected with mRNA encoding WT Shp1 or Shp1-R462M, showing the total neutrophil numbers at 5 days post injection per embryo. Quantification was performed in ImageJ by particle analysis. Following imaging, the embryos were genotyped by PCR and sequencing. Statistical comparisons were performed by one-way ANOVA and Tukey’s multiple comparisons test. Scale bars: 0.1 mm (A-D); 0.2 mm (G,H). *P<0.05, **P<0.01, ***P<0.001, ****P<0.0001. Error bars show the s.e.m.